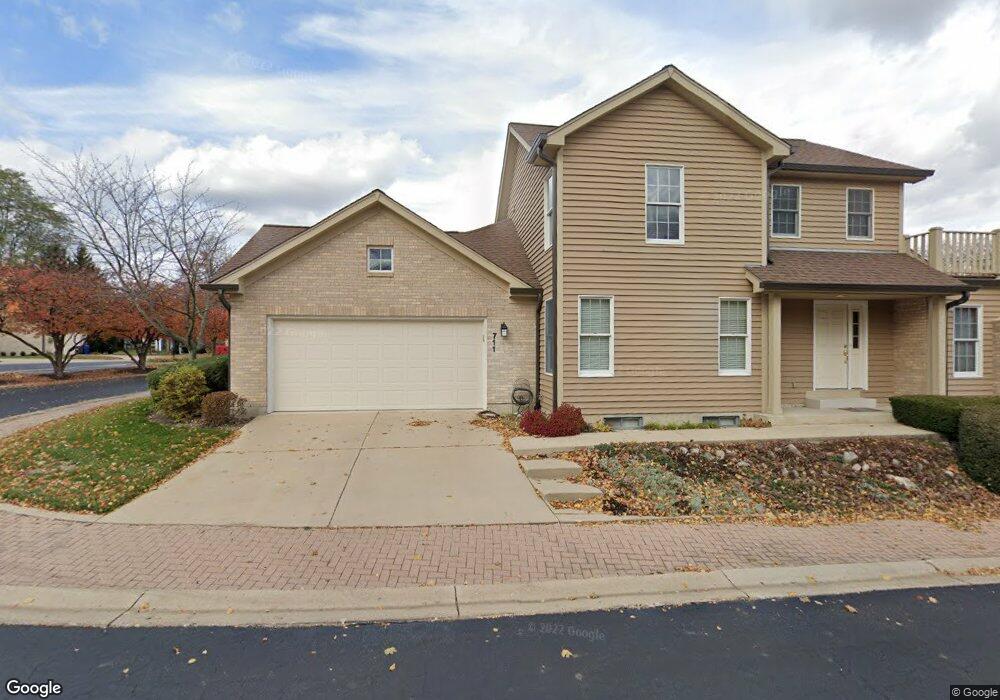
711 Natwill Square Geneva, IL 60134
Northwest Central Geneva NeighborhoodEstimated Value: $540,000 - $716,000
3
Beds
3
Baths
2,278
Sq Ft
$269/Sq Ft
Est. Value
About This Home
This home is located at 711 Natwill Square, Geneva, IL 60134 and is currently estimated at $612,677, approximately $268 per square foot. 711 Natwill Square is a home located in Kane County with nearby schools including Williamsburg Elementary School, Geneva Community High School, and St. Peter School.
Ownership History
Date
Name
Owned For
Owner Type
Purchase Details
Closed on
Jul 1, 2022
Sold by
Schoedel Carl and Schoedel Lisa M
Bought by
Starfish Trust and Schoedel
Current Estimated Value
Purchase Details
Closed on
Mar 31, 2004
Sold by
Wheelock Gary K and Wheelock Nancy J
Bought by
Schoedel Carl and Schoedel Lisa M
Home Financials for this Owner
Home Financials are based on the most recent Mortgage that was taken out on this home.
Original Mortgage
$264,000
Interest Rate
5.65%
Mortgage Type
Stand Alone Second
Purchase Details
Closed on
May 11, 1998
Sold by
Brummel Irvin F
Bought by
Wheelock Gary K and Wheelock Nancy J
Purchase Details
Closed on
Jan 15, 1997
Sold by
Brummel Irvin F
Bought by
Wheelock Gary K and Wheelock Nancy J
Home Financials for this Owner
Home Financials are based on the most recent Mortgage that was taken out on this home.
Original Mortgage
$214,600
Interest Rate
7.66%
Create a Home Valuation Report for This Property
The Home Valuation Report is an in-depth analysis detailing your home's value as well as a comparison with similar homes in the area
Home Values in the Area
Average Home Value in this Area
Purchase History
| Date | Buyer | Sale Price | Title Company |
|---|---|---|---|
| Starfish Trust | -- | Law Diana M | |
| Schoedel Carl | $330,000 | -- | |
| Wheelock Gary K | -- | Fox Title Company | |
| Wheelock Gary K | $285,000 | Fox Title Company |
Source: Public Records
Mortgage History
| Date | Status | Borrower | Loan Amount |
|---|---|---|---|
| Previous Owner | Schoedel Carl | $264,000 | |
| Previous Owner | Wheelock Gary K | $214,600 | |
| Closed | Schoedel Carl | $33,000 |
Source: Public Records
Tax History
| Year | Tax Paid | Tax Assessment Tax Assessment Total Assessment is a certain percentage of the fair market value that is determined by local assessors to be the total taxable value of land and additions on the property. | Land | Improvement |
|---|---|---|---|---|
| 2024 | $10,240 | $142,576 | $29,208 | $113,368 |
| 2023 | $9,977 | $129,615 | $26,553 | $103,062 |
| 2022 | $9,555 | $120,438 | $24,673 | $95,765 |
| 2021 | $9,274 | $115,962 | $23,756 | $92,206 |
| 2020 | $9,167 | $114,192 | $23,393 | $90,799 |
| 2019 | $9,143 | $112,030 | $22,950 | $89,080 |
| 2018 | $8,911 | $109,497 | $22,950 | $86,547 |
| 2017 | $8,810 | $106,577 | $22,338 | $84,239 |
| 2016 | $8,853 | $105,137 | $22,036 | $83,101 |
| 2015 | -- | $99,959 | $20,951 | $79,008 |
| 2014 | -- | $99,301 | $20,951 | $78,350 |
| 2013 | -- | $99,301 | $20,951 | $78,350 |
Source: Public Records
Map
Nearby Homes
- 709 Natwill Square
- 707 Natwill Square
- 720 Natwill Square
- 718 Natwill Square
- 109 Kenston Ct
- 109 Kenston Ct Unit 109
- 107 Kenston Ct
- 705 Natwill Square
- 105 Kenston Ct
- 714 Natwill Square
- 103 Kenston Ct
- 712 Natwill Square
- 716 Natwill Square
- 702 Natwill Square
- 713 Campbell St
- 704 Natwill Square
- 712 Campbell St
- 708 Natwill Square
- 229 Campbell Ct
Your Personal Tour Guide
Ask me questions while you tour the home.