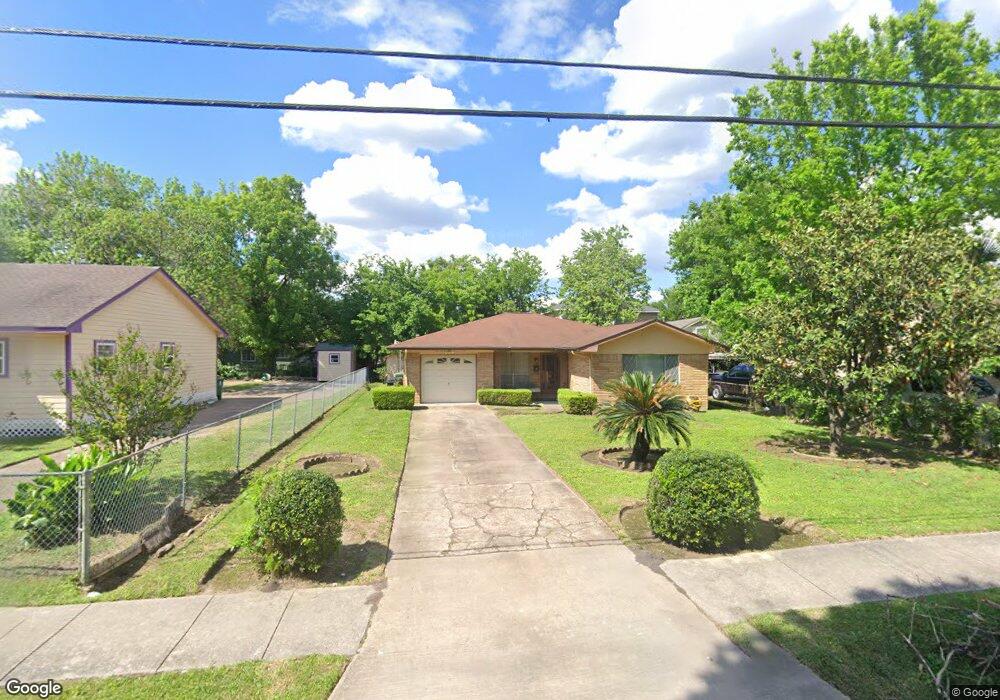
711 Neyland St Houston, TX 77022
Independence Heights NeighborhoodEstimated Value: $237,000 - $243,000
3
Beds
2
Baths
1,445
Sq Ft
$166/Sq Ft
Est. Value
About This Home
This home is located at 711 Neyland St, Houston, TX 77022 and is currently estimated at $240,217, approximately $166 per square foot. 711 Neyland St is a home located in Harris County with nearby schools including Kennedy Elementary School, Williams Middle, and Booker T Washington Sr High.
Ownership History
Date
Name
Owned For
Owner Type
Purchase Details
Closed on
Apr 22, 2025
Sold by
Carson Maxine
Bought by
Argudin Janice
Current Estimated Value
Purchase Details
Closed on
Mar 1, 2006
Sold by
Wolford Jolonda Shunte
Bought by
Carson Maxine
Purchase Details
Closed on
Feb 14, 2006
Sold by
Carson Maxine
Bought by
Carson Maxine and Wolford Regina Leshe
Create a Home Valuation Report for This Property
The Home Valuation Report is an in-depth analysis detailing your home's value as well as a comparison with similar homes in the area
Home Values in the Area
Average Home Value in this Area
Purchase History
| Date | Buyer | Sale Price | Title Company |
|---|---|---|---|
| Argudin Janice | -- | None Listed On Document | |
| Carson Maxine | $13,375 | None Available | |
| Carson Maxine | $13,375 | None Available | |
| Carson Maxine | $13,375 | None Available | |
| Carson Maxine | $13,375 | None Available | |
| Carson Maxine | -- | None Available |
Source: Public Records
Tax History Compared to Growth
Tax History
| Year | Tax Paid | Tax Assessment Tax Assessment Total Assessment is a certain percentage of the fair market value that is determined by local assessors to be the total taxable value of land and additions on the property. | Land | Improvement |
|---|---|---|---|---|
| 2025 | $4,865 | $222,566 | $145,800 | $76,766 |
| 2024 | $4,865 | $232,522 | $145,800 | $86,722 |
| 2023 | $4,865 | $200,711 | $129,600 | $71,111 |
| 2022 | $4,447 | $201,964 | $129,600 | $72,364 |
| 2021 | $3,974 | $170,529 | $102,600 | $67,929 |
| 2020 | $3,833 | $158,278 | $97,200 | $61,078 |
| 2019 | $3,393 | $134,100 | $48,600 | $85,500 |
| 2018 | $3,305 | $130,623 | $48,600 | $82,023 |
| 2017 | $2,932 | $115,971 | $32,400 | $83,571 |
| 2016 | $2,508 | $99,205 | $21,600 | $77,605 |
| 2015 | $2,159 | $99,418 | $21,600 | $77,818 |
| 2014 | $2,159 | $84,000 | $14,850 | $69,150 |
Source: Public Records
Map
Nearby Homes
- 4206 Oxford St
- 603 Neyland
- 4303 Cadmus St
- 508 Neyland St
- 515 E 43rd St
- 821 Neyland St
- 435 Neyland St
- 431 Neyland St
- 436 Neyland St Unit 1
- 821 Barkley St
- 4303 Castor St
- 606 E 42nd St
- 4303 Castor Na St
- 434 Barkley St
- 4305 Castor St
- 4208 Castor St Unit B
- 4208 Castor St Unit A
- 502 W Crosstimbers St
- 4109 Castor St Unit B
- 412 E Neyland St Unit F
- 715 Neyland St
- 607 Neyland St
- 717 Neyland St
- 610 Barkley St
- 605 Neyland St
- 710 Barkley St Unit A
- 710 Barkley St Unit B
- 710 Barkley St Unit AB
- 608 Barkley St
- 719 Neyland St
- 712 Barkley St
- 702 Neyland St
- 706 Neyland St
- 606 Neyland St
- 604 Barkley St
- 721 Neyland St
- 710 Neyland St
- 714 Barkley St
- 716 Barkley St
- 604 Neyland St