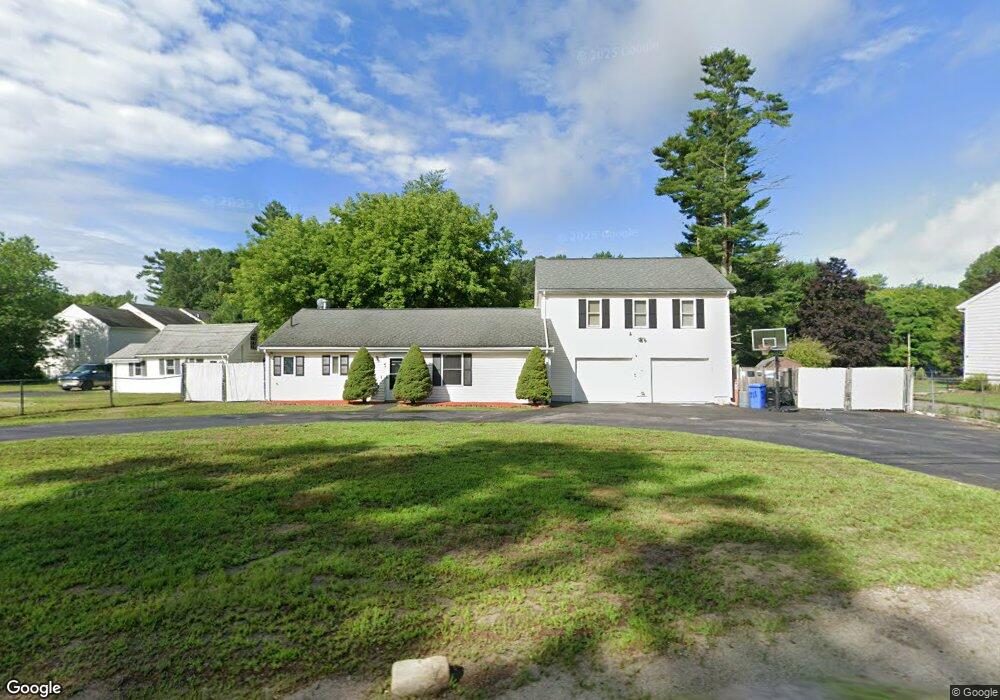
711 Plain St Brockton, MA 02302
Estimated Value: $506,000 - $534,357
3
Beds
1
Bath
1,008
Sq Ft
$520/Sq Ft
Est. Value
About This Home
This home is located at 711 Plain St, Brockton, MA 02302 and is currently estimated at $524,589, approximately $520 per square foot. 711 Plain St is a home located in Plymouth County with nearby schools including Gilmore Elementary School, Davis K-8 School, and John F. Kennedy Elementary School.
Ownership History
Date
Name
Owned For
Owner Type
Purchase Details
Closed on
Nov 1, 2018
Sold by
Hinnant Frances
Bought by
Hinnant Frances D and Arsenault Christina
Current Estimated Value
Purchase Details
Closed on
Apr 4, 2007
Sold by
Frank Eric N and Shea Michele J
Bought by
Hinnant Frances
Home Financials for this Owner
Home Financials are based on the most recent Mortgage that was taken out on this home.
Original Mortgage
$216,800
Interest Rate
6.25%
Mortgage Type
Purchase Money Mortgage
Purchase Details
Closed on
Sep 19, 2003
Sold by
Giessow David A and Mcgee Randy B
Bought by
Shea Michele J and Frank Eric N
Purchase Details
Closed on
Jun 13, 2002
Sold by
Savage Clyde
Bought by
Cgiessow David A and Mcgee Randy B
Purchase Details
Closed on
Mar 27, 1995
Sold by
Krystallidis Evagelos
Bought by
Savage Clyde
Create a Home Valuation Report for This Property
The Home Valuation Report is an in-depth analysis detailing your home's value as well as a comparison with similar homes in the area
Purchase History
| Date | Buyer | Sale Price | Title Company |
|---|---|---|---|
| Hinnant Frances D | -- | -- | |
| Hinnant Frances | $271,000 | -- | |
| Shea Michele J | $240,000 | -- | |
| Cgiessow David A | $95,000 | -- | |
| Savage Clyde | $40,000 | -- |
Source: Public Records
Mortgage History
| Date | Status | Borrower | Loan Amount |
|---|---|---|---|
| Previous Owner | Savage Clyde | $216,800 | |
| Previous Owner | Savage Clyde | $54,200 | |
| Previous Owner | Savage Clyde | $37,150 |
Source: Public Records
Tax History
| Year | Tax Paid | Tax Assessment Tax Assessment Total Assessment is a certain percentage of the fair market value that is determined by local assessors to be the total taxable value of land and additions on the property. | Land | Improvement |
|---|---|---|---|---|
| 2025 | $5,377 | $444,000 | $181,500 | $262,500 |
| 2024 | $5,337 | $444,000 | $181,500 | $262,500 |
| 2023 | $5,130 | $395,200 | $135,100 | $260,100 |
| 2022 | $4,783 | $342,400 | $122,800 | $219,600 |
| 2021 | $4,372 | $301,500 | $107,400 | $194,100 |
| 2020 | $4,733 | $312,400 | $93,600 | $218,800 |
| 2019 | $3,944 | $253,800 | $89,300 | $164,500 |
| 2018 | $3,414 | $212,600 | $89,300 | $123,300 |
| 2017 | $3,243 | $201,400 | $89,300 | $112,100 |
| 2016 | $3,172 | $182,700 | $85,800 | $96,900 |
| 2015 | $2,891 | $159,300 | $85,800 | $73,500 |
| 2014 | $2,758 | $152,100 | $85,800 | $66,300 |
Source: Public Records
Map
Nearby Homes
- 1 Thomas Cir
- 578 Plain St
- 463 Pleasant St
- 10 Colleen Way
- 31 Friendship Dr
- 16 Liberty St
- 18 American Ave
- 23 Dondi Rd
- 118 Deanna Rd
- 323 Matfield St
- 16 Jason Way
- 55 Marjan Dr
- 15 Wachusetts Rd
- 12 Paulin Ave
- 9 Longworth Ave Unit 135
- 9 Longworth Ave Unit 113
- 15 Longworth Ave Unit 226
- 505 N Central St
- 25 Longworth Ave Unit 4
- 35 Longworth Ave Unit 25
- 721 Plain St
- 709 Plain St
- 74 Plain St
- 3 Thomas Cir Unit 3
- 3 Thomas Cir
- 3 Thomas Cir
- 716 Plain St
- 724 Plain St
- 708 Plain St
- 77 Plain St
- 9 Waverly Park Ave
- 7 Thomas Cir
- 7 Thomas Cir Unit A
- 8 Thomas Cir Unit A
- 8 Thomas Cir
- 7 Waverly Park Ave
- Lot #6 Thomas Cir
- Lots 6-7-8 Thomas Cir
- 73 Plain St
- 15 Waverly Park Ave
Your Personal Tour Guide
Ask me questions while you tour the home.