
Landlord's Agent in 2024
Jackson Sanderson
Berkshire Hathaway HomeServices Chicago
(847) 373-9153
153 Total Sales

Estimated Value: $252,000 - $265,241
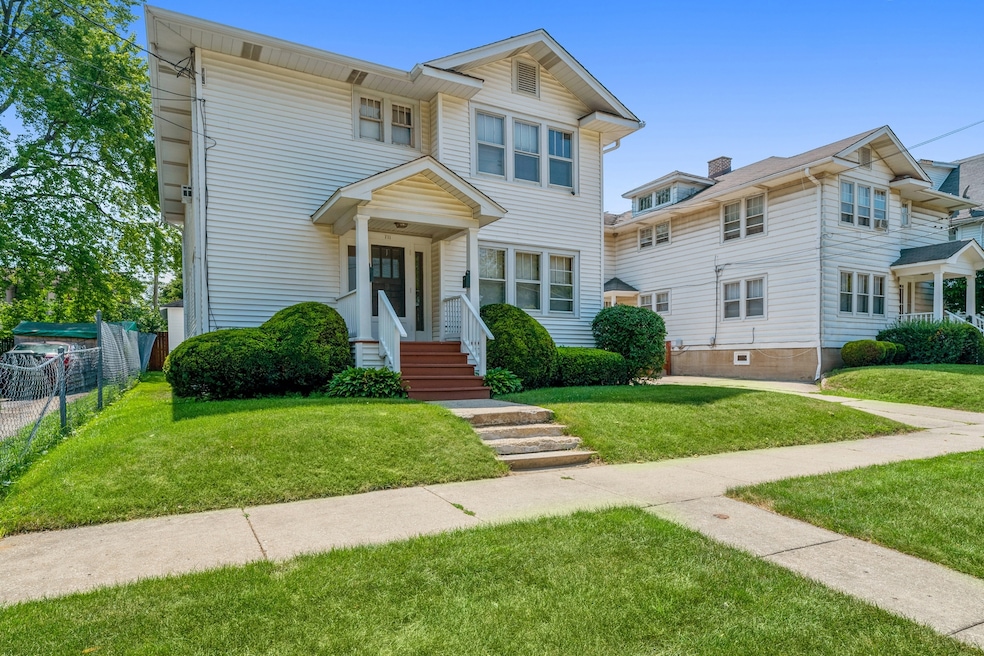
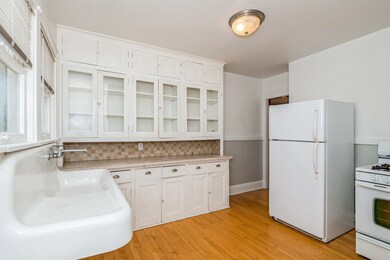
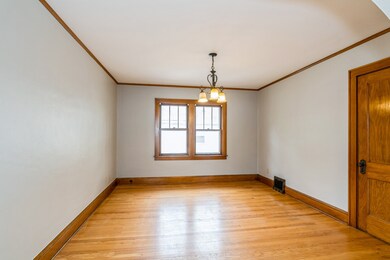
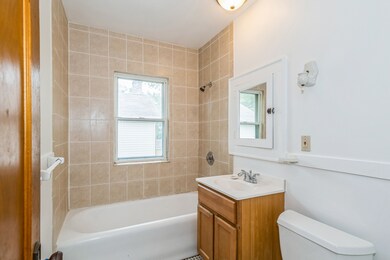
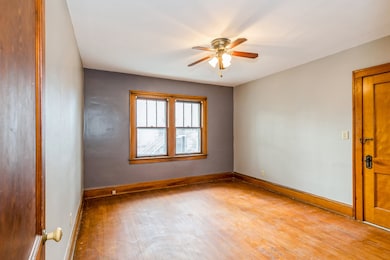
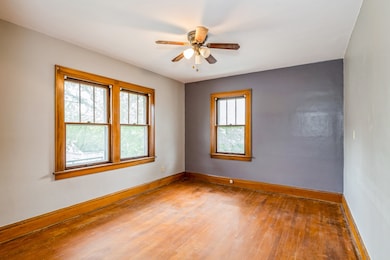
Spacious lower level duplex available for rent. Unit features 2 bedrooms with walk-in closets, 1 full bathroom, and a full kitchen with pantry. All hardwood floors. Shared basement with laundry hookups available and on-site storage. Garage is a shared carport space. $1200/mo rent with $1200 security deposit includes water, scavenger, lawn care and snow removal. All other utilities paid for by tenant. No pets, no smoking. Schedule a showing today before it's gone!
Last Agent to Rent the Property
Berkshire Hathaway HomeServices Chicago License #471016762 Listed on: 08/08/2024
Last Renter's Agent
Non Member
NON MEMBER
| Date | Buyer | Sale Price | Title Company |
|---|---|---|---|
| Chisholm Zhita | $183,500 | Chicago Title |
| Date | Status | Borrower | Loan Amount |
|---|---|---|---|
| Open | Chisholm Zhita | $137,625 |
| Date | Event | Price | List to Sale | Price per Sq Ft | Prior Sale |
|---|---|---|---|---|---|
| 09/16/2024 09/16/24 | Rented | $1,200 | 0.0% | -- | |
| 08/08/2024 08/08/24 | For Rent | $1,200 | 0.0% | -- | |
| 03/03/2023 03/03/23 | Rented | $1,200 | 0.0% | -- | |
| 01/17/2023 01/17/23 | Under Contract | -- | -- | -- | |
| 12/08/2022 12/08/22 | For Rent | $1,200 | 0.0% | -- | |
| 11/08/2021 11/08/21 | Rented | -- | -- | -- | |
| 11/01/2021 11/01/21 | For Rent | $1,200 | 0.0% | -- | |
| 08/05/2021 08/05/21 | Rented | -- | -- | -- | |
| 07/27/2021 07/27/21 | For Rent | $1,200 | 0.0% | -- | |
| 07/21/2021 07/21/21 | Sold | $183,500 | -3.3% | $70 / Sq Ft | View Prior Sale |
| 05/28/2021 05/28/21 | Pending | -- | -- | -- | |
| 05/20/2021 05/20/21 | For Sale | $189,700 | -- | $72 / Sq Ft |
| Year | Tax Paid | Tax Assessment Tax Assessment Total Assessment is a certain percentage of the fair market value that is determined by local assessors to be the total taxable value of land and additions on the property. | Land | Improvement |
|---|---|---|---|---|
| 2024 | $5,953 | $70,040 | $6,001 | $64,039 |
| 2023 | $5,814 | $63,127 | $5,373 | $57,754 |
| 2022 | $5,814 | $59,475 | $5,111 | $54,364 |
| 2021 | $6,147 | $58,964 | $4,559 | $54,405 |
| 2020 | $6,227 | $54,932 | $4,247 | $50,685 |
| 2019 | $6,267 | $50,337 | $3,892 | $46,445 |
| 2018 | $6,526 | $50,480 | $4,957 | $45,523 |
| 2017 | $6,353 | $44,661 | $4,386 | $40,275 |
| 2016 | $5,997 | $38,808 | $3,811 | $34,997 |
| 2015 | $5,867 | $34,734 | $3,411 | $31,323 |
| 2014 | $4,195 | $24,795 | $3,243 | $21,552 |
| 2012 | $5,199 | $26,864 | $3,514 | $23,350 |
Landlord's Agent in 2024
Jackson Sanderson
Berkshire Hathaway HomeServices Chicago
(847) 373-9153
153 Total Sales
Landlord's Co-Listing Agent in 2024
Alysia Bridges
Berkshire Hathaway HomeServices Chicago
1 Total Sale
N
Tenant's Agent in 2024
Non Member
NON MEMBER
Seller's Agent in 2021
Kris Seegren
RE/MAX Plaza
(847) 772-6139
118 Total Sales
Source: Midwest Real Estate Data (MRED)
MLS Number: 12132036
APN: 08-21-118-010
Disclaimer: Certain information contained herein is derived from information provided by parties other than Homes.com. All information provided is deemed reliable, but is not guaranteed to be accurate and should be independently verified.
![]() Based on information submitted to the MLS GRID. All data is obtained from various sources and may not have been verified by broker or MLS GRID. Supplied Open House Information is subject to change without notice. All information should be independently reviewed and verified for accuracy. Properties may or may not be listed by the office/agent presenting the information. Some IDX listings have been excluded from this website.
Based on information submitted to the MLS GRID. All data is obtained from various sources and may not have been verified by broker or MLS GRID. Supplied Open House Information is subject to change without notice. All information should be independently reviewed and verified for accuracy. Properties may or may not be listed by the office/agent presenting the information. Some IDX listings have been excluded from this website.
The Digital Millennium Copyright Act of 1998, 17 U.S.C. § 512 (the “DMCA”) provides recourse for copyright owners who believe that material appearing on the Internet infringes their rights under U.S. copyright law. If you believe in good faith that any content or material made available in connection with our website or services infringes your copyright, you (or your agent) may send us a notice requesting that the content or material be removed, or access to it blocked.
Notices must be sent in writing by email to DMCAnotice@MLSGrid.com.
The DMCA requires that your notice of alleged copyright infringement include the following information:
(1) description of the copyrighted work that is the subject of claimed infringement;
(2) description of the alleged infringing content and information sufficient to permit us to locate the content;
(3) contact information for you, including your address, telephone number and email address;
(4) a statement by you that you have a good faith belief that the content in the manner complained of is not authorized by the copyright owner, or its agent, or by the operation of any law;
(5) a statement by you, signed under penalty of perjury, that the information in the notification is accurate and that you have the authority to enforce the copyrights that are claimed to be infringed; and
(6) a physical or electronic signature of the copyright owner or a person authorized to act on the copyright owner’s behalf. Failure to include all of the above information may result in the delay of the processing of your complaint.