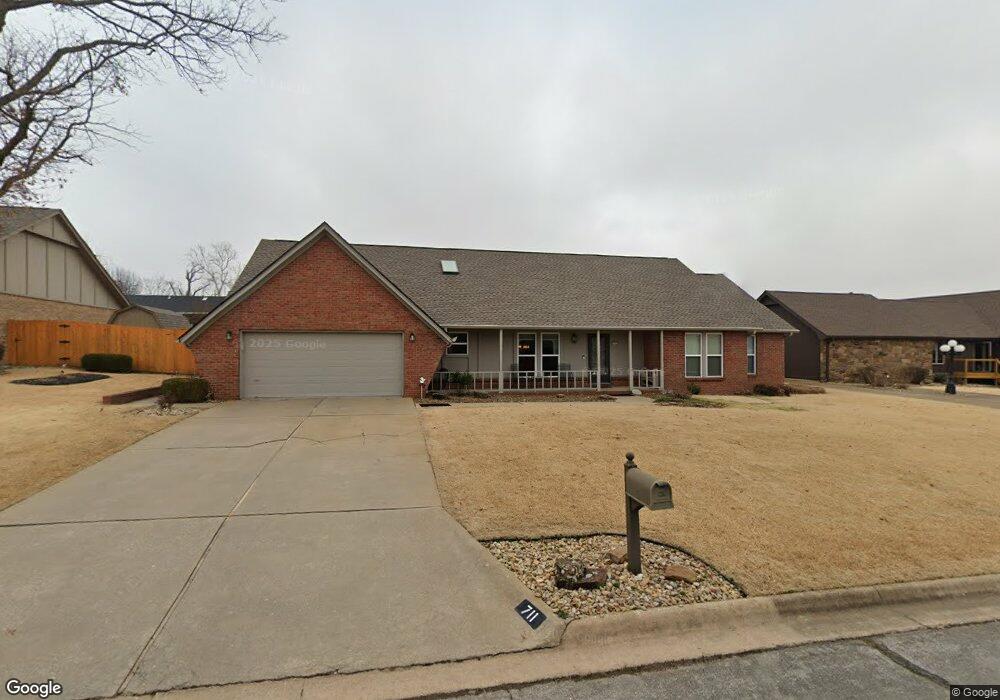
711 Rochelle Ct Rogers, AR 72758
Estimated Value: $408,134 - $452,000
--
Bed
3
Baths
2,496
Sq Ft
$176/Sq Ft
Est. Value
About This Home
This home is located at 711 Rochelle Ct, Rogers, AR 72758 and is currently estimated at $438,284, approximately $175 per square foot. 711 Rochelle Ct is a home located in Benton County with nearby schools including Westside Elementary School, Oakdale Middle School, and Rogers Heritage High School.
Ownership History
Date
Name
Owned For
Owner Type
Purchase Details
Closed on
Oct 18, 2021
Sold by
Don Loveland Revocable Trust and Loveland Donald Eugene
Bought by
Loveland Donald E
Current Estimated Value
Home Financials for this Owner
Home Financials are based on the most recent Mortgage that was taken out on this home.
Original Mortgage
$139,500
Outstanding Balance
$107,198
Interest Rate
2.1%
Mortgage Type
New Conventional
Estimated Equity
$331,086
Purchase Details
Closed on
Mar 4, 2016
Sold by
Loveland Donald E and Loveland Judith A
Bought by
Loveland Donald E
Purchase Details
Closed on
Aug 16, 1993
Bought by
Loveland
Purchase Details
Closed on
Sep 17, 1990
Bought by
Blevins
Purchase Details
Closed on
Oct 14, 1986
Bought by
Smalley
Purchase Details
Closed on
Jul 2, 1986
Bought by
Cavazos
Purchase Details
Closed on
Sep 26, 1985
Bought by
Rogers Co
Create a Home Valuation Report for This Property
The Home Valuation Report is an in-depth analysis detailing your home's value as well as a comparison with similar homes in the area
Home Values in the Area
Average Home Value in this Area
Purchase History
| Date | Buyer | Sale Price | Title Company |
|---|---|---|---|
| Loveland Donald E | -- | Lenders Title Company | |
| Loveland Donald E | -- | Attorney | |
| Loveland | $139,000 | -- | |
| Blevins | $132,000 | -- | |
| Smalley | $118,000 | -- | |
| Cavazos | $120,000 | -- | |
| Rogers Co | $12,000 | -- |
Source: Public Records
Mortgage History
| Date | Status | Borrower | Loan Amount |
|---|---|---|---|
| Open | Loveland Donald E | $139,500 |
Source: Public Records
Tax History Compared to Growth
Tax History
| Year | Tax Paid | Tax Assessment Tax Assessment Total Assessment is a certain percentage of the fair market value that is determined by local assessors to be the total taxable value of land and additions on the property. | Land | Improvement |
|---|---|---|---|---|
| 2025 | $1,753 | $75,962 | $19,000 | $56,962 |
| 2024 | $1,711 | $75,962 | $19,000 | $56,962 |
| 2023 | $1,711 | $50,420 | $9,000 | $41,420 |
| 2022 | $1,404 | $50,420 | $9,000 | $41,420 |
| 2021 | $1,399 | $50,420 | $9,000 | $41,420 |
| 2020 | $1,400 | $38,270 | $4,600 | $33,670 |
| 2019 | $1,400 | $38,270 | $4,600 | $33,670 |
| 2018 | $1,425 | $38,270 | $4,600 | $33,670 |
| 2017 | $1,442 | $38,270 | $4,600 | $33,670 |
| 2016 | $1,328 | $38,270 | $4,600 | $33,670 |
| 2015 | $1,711 | $32,340 | $4,600 | $27,740 |
| 2014 | $1,361 | $32,340 | $4,600 | $27,740 |
Source: Public Records
Map
Nearby Homes
- 2512 W Beau Dr
- 2601 W Oak St Unit 2
- 2503 W Oak St
- 904 S Dixson St Unit B
- 2309 & 2311 W Pecan St
- 904 S Lafayette St
- 910 S 28th St
- 908 & 910 S 28th St
- 908 S 28th St Unit A & B
- 916 Lafayette St
- 2732 Highland Cir
- 2824 Highland Dr Unit 1
- 916 S 25th Place
- 2308 W Willow St
- 0 N 23rd St
- 2202 W Oak St
- 835 S 40th St
- 708 N 28th St
- 2104 W Oak St
- 707 Turtle Creek Dr
- 707 Rochelle Ct
- 719 Rochelle Ct
- 712 Chateau Dr
- 708 Chateau Dr
- 718 Chateau Dr
- 701 Rochelle Ct
- 723 Rochelle Ct
- 708 Rochelle Ct
- 702 Rochelle Ct
- 724 Chateau Dr
- 702 Chateau Dr
- 712 Rochelle Ct
- 611 Rochelle Ct
- 611 S Rochelle Ct
- 2610 Dauphine Dr
- 711 Chateau Dr
- 612 Chateau Dr
- 717 Chateau Dr
- 707 Chateau Dr
- 728 Chateau Dr