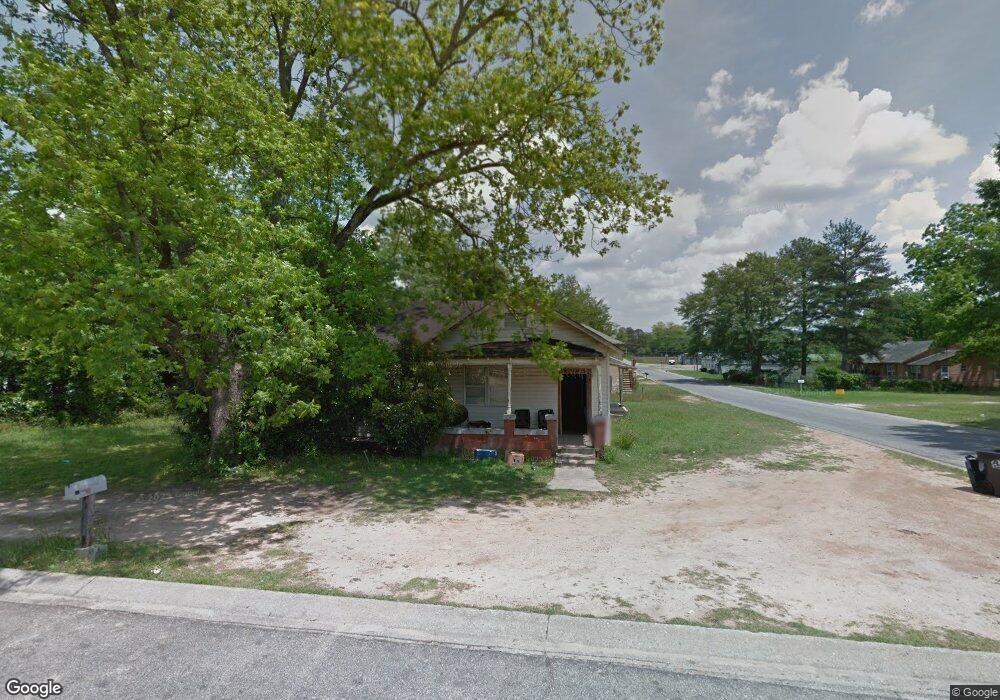
711 S 12th St Cordele, GA 31015
Estimated Value: $49,992 - $234,000
3
Beds
1
Bath
1,215
Sq Ft
$92/Sq Ft
Est. Value
About This Home
This home is located at 711 S 12th St, Cordele, GA 31015 and is currently estimated at $111,664, approximately $91 per square foot. 711 S 12th St is a home located in Crisp County with nearby schools including Crisp County Elementary School, Crisp County Primary School, and Crisp County Middle School.
Ownership History
Date
Name
Owned For
Owner Type
Purchase Details
Closed on
Mar 14, 2013
Sold by
Fraser Michael D
Bought by
Sylvester Phillips
Current Estimated Value
Purchase Details
Closed on
Jun 5, 2012
Sold by
Adkins Cricket
Bought by
Fraser Michael S
Purchase Details
Closed on
Jan 21, 1997
Sold by
Walker Timothy M
Bought by
Booker Pearl
Purchase Details
Closed on
Feb 6, 1996
Sold by
Harris Annie Mae
Bought by
Walker Timothy M
Purchase Details
Closed on
Apr 19, 1988
Bought by
Phillips Sylvester
Purchase Details
Closed on
Jul 1, 1936
Bought by
Phillips Sylvester
Purchase Details
Closed on
Jun 15, 1925
Bought by
Harris Annie Mae
Create a Home Valuation Report for This Property
The Home Valuation Report is an in-depth analysis detailing your home's value as well as a comparison with similar homes in the area
Home Values in the Area
Average Home Value in this Area
Purchase History
| Date | Buyer | Sale Price | Title Company |
|---|---|---|---|
| Sylvester Phillips | $1,228 | -- | |
| Fraser Michael S | $945 | -- | |
| Booker Pearl | $10,000 | -- | |
| Walker Timothy M | -- | -- | |
| Phillips Sylvester | -- | -- | |
| Phillips Sylvester | -- | -- | |
| Harris Annie Mae | -- | -- |
Source: Public Records
Tax History Compared to Growth
Tax History
| Year | Tax Paid | Tax Assessment Tax Assessment Total Assessment is a certain percentage of the fair market value that is determined by local assessors to be the total taxable value of land and additions on the property. | Land | Improvement |
|---|---|---|---|---|
| 2024 | $270 | $7,536 | $1,250 | $6,286 |
| 2023 | $270 | $7,203 | $1,250 | $5,953 |
| 2022 | $182 | $6,870 | $1,250 | $5,620 |
| 2021 | $178 | $6,537 | $1,250 | $5,287 |
| 2020 | $184 | $6,537 | $1,250 | $5,287 |
| 2019 | $185 | $6,537 | $1,250 | $5,287 |
| 2018 | $153 | $5,181 | $1,875 | $3,306 |
| 2017 | $210 | $5,181 | $1,875 | $3,306 |
| 2016 | $153 | $5,181 | $1,875 | $3,306 |
| 2015 | -- | $5,181 | $1,875 | $3,306 |
| 2014 | -- | $5,181 | $1,875 | $3,306 |
| 2013 | -- | $5,180 | $1,874 | $3,306 |
Source: Public Records
Map
Nearby Homes