711 S 70 E Smithfield, UT 84335
Estimated Value: $344,667 - $348,000
3
Beds
3
Baths
1,377
Sq Ft
$251/Sq Ft
Est. Value
About This Home
This home is located at 711 S 70 E, Smithfield, UT 84335 and is currently estimated at $346,167, approximately $251 per square foot. 711 S 70 E is a home located in Cache County with nearby schools including Summit School, Cedar Ridge School, and North Cache Middle School.
Ownership History
Date
Name
Owned For
Owner Type
Purchase Details
Closed on
Nov 27, 2019
Sold by
Johnson Peter and Johnson Jessica
Bought by
Eastview Haven Llc
Current Estimated Value
Purchase Details
Closed on
May 21, 2019
Sold by
Sweeten Maddison
Bought by
Johnson Peter and Johnson Jessica
Home Financials for this Owner
Home Financials are based on the most recent Mortgage that was taken out on this home.
Original Mortgage
$153,000
Interest Rate
4%
Mortgage Type
New Conventional
Purchase Details
Closed on
Apr 20, 2015
Sold by
North Ridge Development Llc
Bought by
Sweeten Maddison
Home Financials for this Owner
Home Financials are based on the most recent Mortgage that was taken out on this home.
Original Mortgage
$150,408
Interest Rate
3.7%
Mortgage Type
New Conventional
Create a Home Valuation Report for This Property
The Home Valuation Report is an in-depth analysis detailing your home's value as well as a comparison with similar homes in the area
Home Values in the Area
Average Home Value in this Area
Purchase History
| Date | Buyer | Sale Price | Title Company |
|---|---|---|---|
| Eastview Haven Llc | -- | Pinnacle Title Ins Agcy | |
| Johnson Peter | -- | Hickman Land Title Logan | |
| Sweeten Maddison | -- | Hickman Land Title Company |
Source: Public Records
Mortgage History
| Date | Status | Borrower | Loan Amount |
|---|---|---|---|
| Previous Owner | Johnson Peter | $153,000 | |
| Previous Owner | Sweeten Maddison | $150,408 |
Source: Public Records
Tax History
| Year | Tax Paid | Tax Assessment Tax Assessment Total Assessment is a certain percentage of the fair market value that is determined by local assessors to be the total taxable value of land and additions on the property. | Land | Improvement |
|---|---|---|---|---|
| 2025 | $1,276 | $170,805 | $0 | $0 |
| 2023 | $1,577 | $187,275 | $0 | $0 |
| 2022 | $160 | $187,275 | $0 | $0 |
| 2021 | $1,348 | $240,679 | $60,000 | $180,679 |
| 2020 | $1,304 | $217,113 | $60,000 | $157,113 |
| 2019 | $1,147 | $182,113 | $25,000 | $157,113 |
| 2018 | $1,077 | $165,280 | $25,000 | $140,280 |
| 2017 | $1,040 | $87,230 | $0 | $0 |
| 2016 | $1,058 | $78,540 | $0 | $0 |
| 2015 | $957 | $78,540 | $0 | $0 |
| 2014 | $299 | $25,000 | $0 | $0 |
Source: Public Records
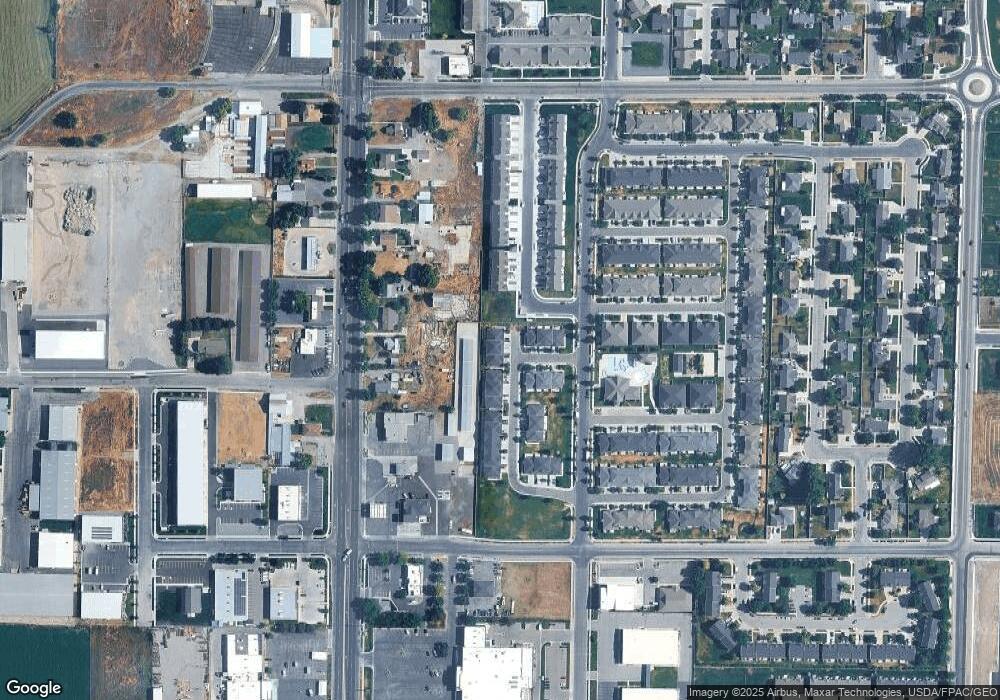
Map
Nearby Homes
Your Personal Tour Guide
Ask me questions while you tour the home.