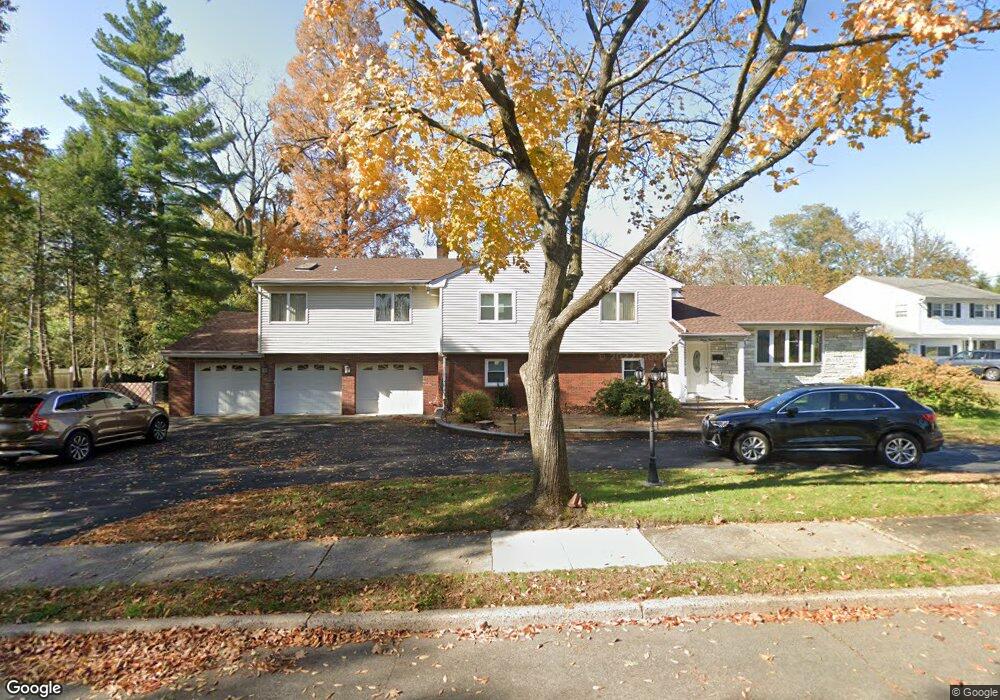
711 Sandor Ct Paramus, NJ 07652
Estimated Value: $1,145,000 - $1,360,000
Studio
--
Bath
3,217
Sq Ft
$386/Sq Ft
Est. Value
About This Home
This home is located at 711 Sandor Ct, Paramus, NJ 07652 and is currently estimated at $1,242,475, approximately $386 per square foot. 711 Sandor Ct is a home located in Bergen County with nearby schools including Paramus High School and Bergen Catholic High School.
Ownership History
Date
Name
Owned For
Owner Type
Purchase Details
Closed on
Jul 13, 2016
Sold by
Tseng Lung Y and Tseng Joan Sc
Bought by
Roy Mathew and Roy Rose
Current Estimated Value
Home Financials for this Owner
Home Financials are based on the most recent Mortgage that was taken out on this home.
Original Mortgage
$450,000
Outstanding Balance
$358,772
Interest Rate
3.54%
Mortgage Type
New Conventional
Estimated Equity
$883,703
Purchase Details
Closed on
Dec 27, 1991
Bought by
Tseng Lung Y and Joan Sc
Create a Home Valuation Report for This Property
The Home Valuation Report is an in-depth analysis detailing your home's value as well as a comparison with similar homes in the area
Home Values in the Area
Average Home Value in this Area
Purchase History
| Date | Buyer | Sale Price | Title Company |
|---|---|---|---|
| Roy Mathew | $680,000 | Attorney | |
| Tseng Lung Y | $272,500 | -- |
Source: Public Records
Mortgage History
| Date | Status | Borrower | Loan Amount |
|---|---|---|---|
| Open | Roy Mathew | $450,000 |
Source: Public Records
Tax History
| Year | Tax Paid | Tax Assessment Tax Assessment Total Assessment is a certain percentage of the fair market value that is determined by local assessors to be the total taxable value of land and additions on the property. | Land | Improvement |
|---|---|---|---|---|
| 2025 | $14,100 | $989,600 | $424,200 | $565,400 |
| 2024 | $13,705 | $931,300 | $393,200 | $538,100 |
| 2023 | $13,014 | $893,400 | $374,700 | $518,700 |
| 2022 | $13,014 | $838,500 | $350,300 | $488,200 |
| 2021 | $12,709 | $768,400 | $319,300 | $449,100 |
| 2020 | $12,004 | $752,600 | $309,800 | $442,800 |
| 2019 | $11,587 | $624,300 | $339,600 | $284,700 |
| 2018 | $11,443 | $624,300 | $339,600 | $284,700 |
| 2017 | $11,244 | $624,300 | $339,600 | $284,700 |
| 2016 | $10,938 | $624,300 | $339,600 | $284,700 |
| 2015 | $10,825 | $624,300 | $339,600 | $284,700 |
| 2014 | $10,732 | $624,300 | $339,600 | $284,700 |
Source: Public Records
Map
Nearby Homes
- 715 Sandor Ct
- 79 E Ridgewood Ave
- 81 E Ridgewood Ave
- 712 Sandor Ct
- 717 Sandor Ct
- 717 Sandor Ct Unit 1
- 708 Sandor Ct
- 714 Sandor Ct
- 83 E Ridgewood Ave
- 718 Sandor Ct
- 716 Sandor Ct
- 68 Bush Place
- 712 Bush Place
- 91 E Ridgewood Ave
- 74 Crain Rd
- 715 Chadwick Dr
- 70 Crain Rd
- 711 Chadwick Dr
- 717 Chadwick Dr
- 64 Bush Place
Your Personal Tour Guide
Ask me questions while you tour the home.