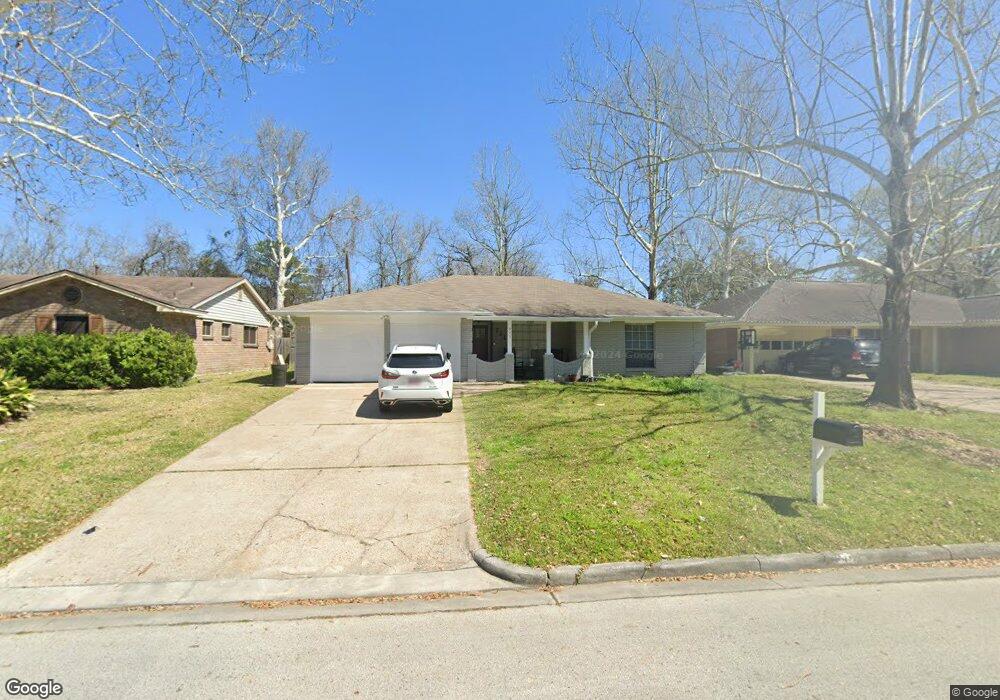
711 Sharon Dr Humble, TX 77338
Estimated Value: $243,389 - $260,000
3
Beds
2
Baths
1,750
Sq Ft
$144/Sq Ft
Est. Value
About This Home
This home is located at 711 Sharon Dr, Humble, TX 77338 and is currently estimated at $251,597, approximately $143 per square foot. 711 Sharon Dr is a home located in Harris County with nearby schools including Lakeland Elementary School, Ross Sterling Middle School, and Humble High School.
Ownership History
Date
Name
Owned For
Owner Type
Purchase Details
Closed on
May 13, 2021
Sold by
Dominguez Reynaldo
Bought by
Carrera Belinda A Gonzalez and Gonzalez Belinda Adel
Current Estimated Value
Purchase Details
Closed on
Jun 28, 2017
Sold by
K & M Real Estate Investments Llc
Bought by
Dominguez Reynaldo and Carrera Belinda A Gonzalez
Home Financials for this Owner
Home Financials are based on the most recent Mortgage that was taken out on this home.
Original Mortgage
$112,000
Interest Rate
4.02%
Mortgage Type
New Conventional
Purchase Details
Closed on
Feb 7, 2017
Sold by
Mallimo Shawn A and Harlan Charles N
Bought by
K & M Real Estate Investments Llc
Purchase Details
Closed on
Jul 11, 2006
Sold by
Singletary W R and Singletary Helen
Bought by
Mallimo Shawn A and Harlan Charles N
Home Financials for this Owner
Home Financials are based on the most recent Mortgage that was taken out on this home.
Original Mortgage
$103,656
Interest Rate
6.66%
Mortgage Type
FHA
Create a Home Valuation Report for This Property
The Home Valuation Report is an in-depth analysis detailing your home's value as well as a comparison with similar homes in the area
Home Values in the Area
Average Home Value in this Area
Purchase History
| Date | Buyer | Sale Price | Title Company |
|---|---|---|---|
| Carrera Belinda A Gonzalez | -- | None Listed On Document | |
| Dominguez Reynaldo | -- | Great American Title Co | |
| K & M Real Estate Investments Llc | $82,000 | None Available | |
| Mallimo Shawn A | -- | Fidelity National Title Co |
Source: Public Records
Mortgage History
| Date | Status | Borrower | Loan Amount |
|---|---|---|---|
| Previous Owner | Dominguez Reynaldo | $112,000 | |
| Previous Owner | Mallimo Shawn A | $103,656 |
Source: Public Records
Tax History Compared to Growth
Tax History
| Year | Tax Paid | Tax Assessment Tax Assessment Total Assessment is a certain percentage of the fair market value that is determined by local assessors to be the total taxable value of land and additions on the property. | Land | Improvement |
|---|---|---|---|---|
| 2025 | $3,630 | $185,970 | $62,488 | $123,482 |
| 2024 | $3,630 | $270,602 | $62,488 | $208,114 |
| 2023 | $3,630 | $318,096 | $34,476 | $283,620 |
| 2022 | $5,776 | $264,034 | $34,476 | $229,558 |
| 2021 | $4,185 | $182,217 | $34,476 | $147,741 |
| 2020 | $4,288 | $182,217 | $34,476 | $147,741 |
| 2019 | $4,082 | $162,510 | $20,686 | $141,824 |
| 2018 | $2,185 | $143,753 | $20,686 | $123,067 |
| 2017 | $2,877 | $116,347 | $20,686 | $95,661 |
| 2016 | $3,198 | $129,306 | $20,686 | $108,620 |
| 2015 | $2,502 | $160,810 | $20,686 | $140,124 |
| 2014 | $2,502 | $101,533 | $20,686 | $80,847 |
Source: Public Records
Map
Nearby Homes
- 106 Eddy St Unit B
- 519 Sharon Dr
- 1207 Mcdugald Rd
- 0 Carolyn Ct
- 1809 Country Village Blvd
- 502 Sammon Dr Unit 1-3
- 1831 Country Village Blvd
- 1907 Country Village Blvd Unit B
- 1210 Lynn Ln
- 2037 Country Village Blvd Unit A
- 1941 Country Village Blvd Unit A
- 2071 Country Village Blvd Unit B
- 2071 Country Village Blvd Unit C
- 144 Willow St Unit 1
- 1211 Main St
- 89 Isaacks Ct
- 712 Higgins St
- 606 Granberry St
- 0 South Ave E
- 0 S Avenue D