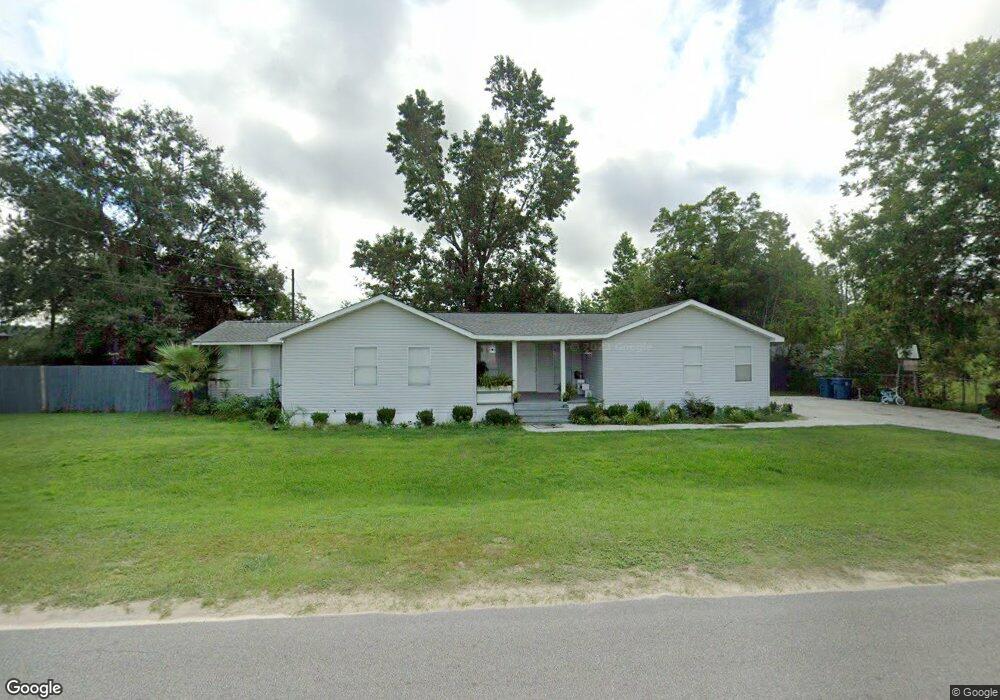
711 Smith Rd Waycross, GA 31503
Estimated Value: $167,000 - $338,000
3
Beds
2
Baths
2,223
Sq Ft
$106/Sq Ft
Est. Value
About This Home
This home is located at 711 Smith Rd, Waycross, GA 31503 and is currently estimated at $235,282, approximately $105 per square foot. 711 Smith Rd is a home located in Ware County with nearby schools including Ruskin Elementary School, Ware County Middle School, and Ware County High School.
Ownership History
Date
Name
Owned For
Owner Type
Purchase Details
Closed on
Sep 22, 2021
Sold by
Galvan Elias
Bought by
Flores Ana R
Current Estimated Value
Home Financials for this Owner
Home Financials are based on the most recent Mortgage that was taken out on this home.
Original Mortgage
$75,000
Outstanding Balance
$63,156
Interest Rate
2.8%
Mortgage Type
Commercial
Estimated Equity
$172,126
Purchase Details
Closed on
Jun 6, 2008
Sold by
Waycross Bank & Trust
Bought by
Flores Ana R
Purchase Details
Closed on
Sep 4, 2007
Sold by
Fagant Richard A
Bought by
Waycross Bank & Trust
Purchase Details
Closed on
Feb 21, 2003
Sold by
Waycross Bank & Trust
Bought by
Fagant Richard A and Fagant Ruth S
Purchase Details
Closed on
Feb 5, 2002
Sold by
Davis Norman James J
Bought by
Waycross Bank & Trust
Purchase Details
Closed on
Aug 28, 1996
Sold by
Davis Norman
Bought by
Davis Norman James J
Purchase Details
Closed on
Mar 8, 1989
Bought by
Davis Norman
Create a Home Valuation Report for This Property
The Home Valuation Report is an in-depth analysis detailing your home's value as well as a comparison with similar homes in the area
Home Values in the Area
Average Home Value in this Area
Purchase History
| Date | Buyer | Sale Price | Title Company |
|---|---|---|---|
| Flores Ana R | -- | -- | |
| Flores Ana R | $65,042 | -- | |
| Waycross Bank & Trust | -- | -- | |
| Fagant Richard A | $53,200 | -- | |
| Waycross Bank & Trust | $50,400 | -- | |
| Davis Norman James J | -- | -- | |
| Davis Norman | $14,300 | -- |
Source: Public Records
Mortgage History
| Date | Status | Borrower | Loan Amount |
|---|---|---|---|
| Open | Flores Ana R | $75,000 |
Source: Public Records
Tax History Compared to Growth
Tax History
| Year | Tax Paid | Tax Assessment Tax Assessment Total Assessment is a certain percentage of the fair market value that is determined by local assessors to be the total taxable value of land and additions on the property. | Land | Improvement |
|---|---|---|---|---|
| 2024 | $651 | $76,584 | $1,660 | $74,924 |
| 2023 | $664 | $45,898 | $568 | $45,330 |
| 2022 | $744 | $45,898 | $568 | $45,330 |
| 2021 | $758 | $32,424 | $568 | $31,856 |
| 2020 | $767 | $31,180 | $568 | $30,612 |
| 2019 | $782 | $29,935 | $568 | $29,367 |
| 2018 | $789 | $28,690 | $568 | $28,122 |
| 2017 | $788 | $28,690 | $568 | $28,122 |
| 2016 | $788 | $28,690 | $568 | $28,122 |
| 2015 | $796 | $28,689 | $568 | $28,122 |
| 2014 | $795 | $28,690 | $568 | $28,122 |
| 2013 | -- | $28,689 | $567 | $28,122 |
Source: Public Records
Map
Nearby Homes
- 524 Smith Rd
- 912 Smith Rd
- 0 (Lot 4) Elmer Thrift Rd
- 0 (Lot 3) Elmer Thrift Rd
- 400 Smith Rd
- 0 Anita St
- 3207 Bertran Trail
- 3222 Bertran Trail
- 1690 Smith Rd
- 274 S Anita St
- 2565 New Jersey Ave
- 2580 Pennsylvania Ave
- 1602 Smith Rd
- 2300 New York Ave
- 0 Anita South St
- 00 Valdosta Hwy
- 0 Valdosta Hwy Unit 7562033
- 0 Valdosta Hwy Unit 10575594
- 0 Valdosta Hwy Unit 10502600
- 2475 Minnesota Ave
- 691 Smith Rd
- 2990 Wadley Rd
- 685 Smith Rd
- 724 Smith Rd
- 680 Smith Rd
- 2970 Wadley Rd
- 3035 Slash Pine Rd
- 2985 Wadley Rd
- 792 Smith Rd
- 755 Smith Rd
- 2969 Wadley Rd
- 2966 Wadley Rd
- 3011 Wadley Rd
- 611 Smith Rd
- 3057 Horseshoe Ln
- 3077 Horseshoe Ln
- 3047 Horseshoe Ln
- 3115 Slash Pine Rd
- 3055 Wadley Rd
- 582 Smith Rd