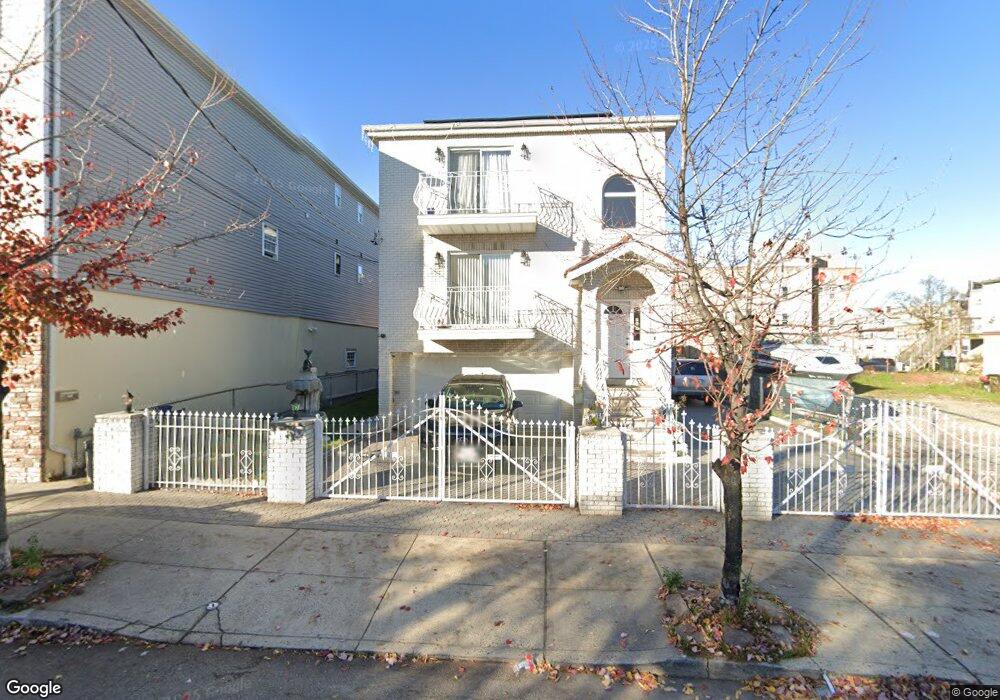
711 Summer St Unit 713 Elizabeth, NJ 07202
Bayway NeighborhoodEstimated Value: $808,000 - $915,000
--
Bed
--
Bath
3,000
Sq Ft
$287/Sq Ft
Est. Value
About This Home
This home is located at 711 Summer St Unit 713, Elizabeth, NJ 07202 and is currently estimated at $859,948, approximately $286 per square foot. 711 Summer St Unit 713 is a home located in Union County with nearby schools including Mabel G. Holmes School No. 5, Elizabeth High School, and Sinai Christian Academy.
Ownership History
Date
Name
Owned For
Owner Type
Purchase Details
Closed on
May 17, 2018
Sold by
Lopes Joao Paulo
Bought by
Paredes Olguer B and Paucer Isabel R
Current Estimated Value
Home Financials for this Owner
Home Financials are based on the most recent Mortgage that was taken out on this home.
Original Mortgage
$210,000
Outstanding Balance
$180,817
Interest Rate
4.4%
Mortgage Type
New Conventional
Estimated Equity
$679,131
Purchase Details
Closed on
May 2, 2017
Sold by
Darosa Jimmy and Darosa Fernanda
Bought by
Lopes Joao Paulo
Purchase Details
Closed on
Jan 9, 2006
Sold by
Sanchez Carlos
Bought by
Sanchez Luis A
Purchase Details
Closed on
Apr 1, 2004
Sold by
Faro Developers Llc
Bought by
Derosa Jimmy
Purchase Details
Closed on
Aug 20, 2003
Sold by
Farmland Dairies Llc
Bought by
Faro Developers
Purchase Details
Closed on
Jul 27, 1998
Sold by
Welsh Farms Inc
Bought by
Parmalat Welsh Farms Inc
Create a Home Valuation Report for This Property
The Home Valuation Report is an in-depth analysis detailing your home's value as well as a comparison with similar homes in the area
Home Values in the Area
Average Home Value in this Area
Purchase History
| Date | Buyer | Sale Price | Title Company |
|---|---|---|---|
| Paredes Olguer B | $480,000 | Multiple | |
| Lopes Joao Paulo | $272,000 | None Available | |
| Sanchez Luis A | -- | -- | |
| Derosa Jimmy | $460,000 | -- | |
| Faro Developers | $205,000 | -- | |
| Parmalat Welsh Farms Inc | $50,000 | First American |
Source: Public Records
Mortgage History
| Date | Status | Borrower | Loan Amount |
|---|---|---|---|
| Open | Paredes Olguer B | $210,000 |
Source: Public Records
Tax History Compared to Growth
Tax History
| Year | Tax Paid | Tax Assessment Tax Assessment Total Assessment is a certain percentage of the fair market value that is determined by local assessors to be the total taxable value of land and additions on the property. | Land | Improvement |
|---|---|---|---|---|
| 2025 | $14,099 | $732,800 | $185,000 | $547,800 |
| 2024 | $16,626 | $732,800 | $185,000 | $547,800 |
| 2023 | $16,626 | $52,900 | $12,500 | $40,400 |
| 2022 | $16,176 | $52,900 | $12,500 | $40,400 |
| 2021 | $15,842 | $52,900 | $12,500 | $40,400 |
| 2020 | $15,484 | $52,900 | $12,500 | $40,400 |
| 2019 | $15,248 | $52,900 | $12,500 | $40,400 |
| 2018 | $15,099 | $52,900 | $12,500 | $40,400 |
| 2017 | $14,678 | $52,900 | $12,500 | $40,400 |
| 2016 | $14,679 | $52,900 | $12,500 | $40,400 |
| 2015 | $13,806 | $52,900 | $12,500 | $40,400 |
| 2014 | $13,392 | $52,900 | $12,500 | $40,400 |
Source: Public Records
Map
Nearby Homes
- 715 Summer St Unit 2
- 558 S Broad St
- 634 S Broad St Unit C2
- 534-536 Maple Ave
- 842 Gibbons Ct
- 859 Bayway Cir Unit 861
- 437 Maple Ave
- 857 Garden St
- 727 Bonnett St Unit 2
- 17 Boyle Place
- 937 S Elmora Ave
- 738 Edgar Rd
- 830 Grove St
- 757 Grier Ave
- 752 Fairbanks St Unit 4
- 622B Clarkson Ave
- 624B Clarkson Ave
- 351 S Broad St Unit 405
- 19 Stewart Place
- 619B Arnett St
- 711-713 Summer St
- 715 Summer St
- 715 Summer St Unit 999
- 717 Summer St Unit 719
- 557 S Broad St Unit A4
- 557 S Broad St Unit C2
- 557 S Broad St Unit A3
- 557 S Broad St Unit B5
- 557 S Broad St Unit C1
- 557 S Broad St Unit C5
- 557 S Broad St Unit B6
- 557 S Broad St Unit B1
- 557 S Broad St Unit B2
- 557 S Broad St Unit C6
- 557 S Broad St Unit A2
- 557 S Broad St Unit B3
- 557 S Broad St Unit C3
- 557 S Broad St Unit A5
- 557 S Broad St Unit A1
- 557 S Broad St Unit B4