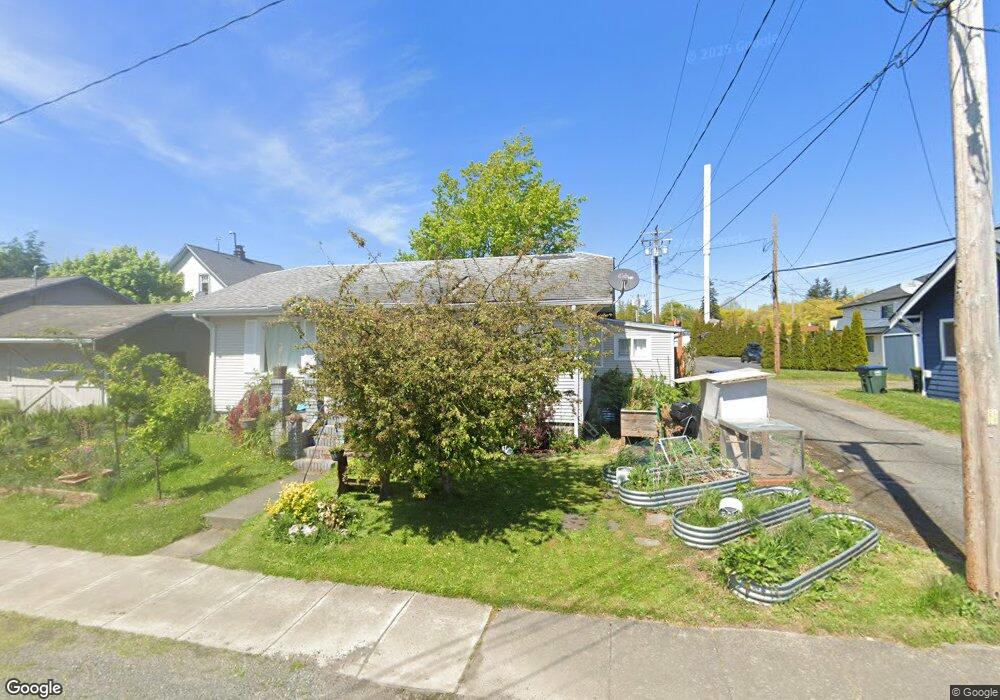
711 Texas St Bellingham, WA 98225
Sunnyland NeighborhoodEstimated Value: $455,000 - $503,000
2
Beds
1
Bath
808
Sq Ft
$593/Sq Ft
Est. Value
About This Home
This home is located at 711 Texas St, Bellingham, WA 98225 and is currently estimated at $479,321, approximately $593 per square foot. 711 Texas St is a home located in Whatcom County with nearby schools including Sunnyland Elementary School, Whatcom Middle School, and Bellingham High School.
Ownership History
Date
Name
Owned For
Owner Type
Purchase Details
Closed on
Jun 21, 2018
Sold by
Bunker James D
Bought by
Czebator Brittany R
Current Estimated Value
Home Financials for this Owner
Home Financials are based on the most recent Mortgage that was taken out on this home.
Original Mortgage
$267,856
Outstanding Balance
$231,651
Interest Rate
4.5%
Mortgage Type
New Conventional
Estimated Equity
$247,670
Purchase Details
Closed on
Feb 1, 2006
Sold by
Day David H and Sanford Lana M
Bought by
Day David H and Day Lana M
Home Financials for this Owner
Home Financials are based on the most recent Mortgage that was taken out on this home.
Original Mortgage
$322,500
Interest Rate
6.1%
Mortgage Type
FHA
Purchase Details
Closed on
Mar 6, 2002
Sold by
Edin Kenneth L
Bought by
Day David H and Sanford Lan
Home Financials for this Owner
Home Financials are based on the most recent Mortgage that was taken out on this home.
Original Mortgage
$44,000
Interest Rate
6.99%
Create a Home Valuation Report for This Property
The Home Valuation Report is an in-depth analysis detailing your home's value as well as a comparison with similar homes in the area
Home Values in the Area
Average Home Value in this Area
Purchase History
| Date | Buyer | Sale Price | Title Company |
|---|---|---|---|
| Czebator Brittany R | $292,500 | Whatcom Land Title | |
| Day David H | -- | Stewart Title Company | |
| Day David H | -- | Whatcom Land Title |
Source: Public Records
Mortgage History
| Date | Status | Borrower | Loan Amount |
|---|---|---|---|
| Open | Czebator Brittany R | $267,856 | |
| Previous Owner | Day David H | $322,500 | |
| Previous Owner | Day David H | $44,000 |
Source: Public Records
Tax History Compared to Growth
Tax History
| Year | Tax Paid | Tax Assessment Tax Assessment Total Assessment is a certain percentage of the fair market value that is determined by local assessors to be the total taxable value of land and additions on the property. | Land | Improvement |
|---|---|---|---|---|
| 2024 | $3,297 | $412,887 | $223,213 | $189,674 |
| 2023 | $3,297 | $423,375 | $228,883 | $194,492 |
| 2022 | $2,691 | $364,984 | $197,316 | $167,668 |
| 2021 | $2,640 | $289,670 | $156,600 | $133,070 |
| 2020 | $2,247 | $268,213 | $145,000 | $123,213 |
| 2019 | $2,012 | $220,719 | $108,141 | $112,578 |
| 2018 | $293 | $198,133 | $97,091 | $101,042 |
| 2017 | $310 | $170,585 | $83,590 | $86,995 |
| 2016 | $309 | $153,659 | $75,010 | $78,649 |
| 2015 | $322 | $140,033 | $68,510 | $71,523 |
| 2014 | -- | $132,859 | $65,000 | $67,859 |
| 2013 | -- | $131,800 | $66,150 | $65,650 |
Source: Public Records
Map
Nearby Homes
- 2627 Iron St
- 2430 Ellis St
- 214 Carolina St
- 2014 Iron St
- 2008 Iron St
- 2500 Cornwall Ave
- 607 E Illinois St
- 3020 E North St
- 3024 E North St
- 2306 C St
- 2019 Cornwall Ave
- 2929 Nevada St
- 2728 Humboldt St
- 2100 C St
- 2518 S Park Dr
- 2716 Sunset Dr
- 1737 Sunup Loop
- 1735 Sunup Loop
- 1733 Sunup Loop
- 1625 Lincoln St