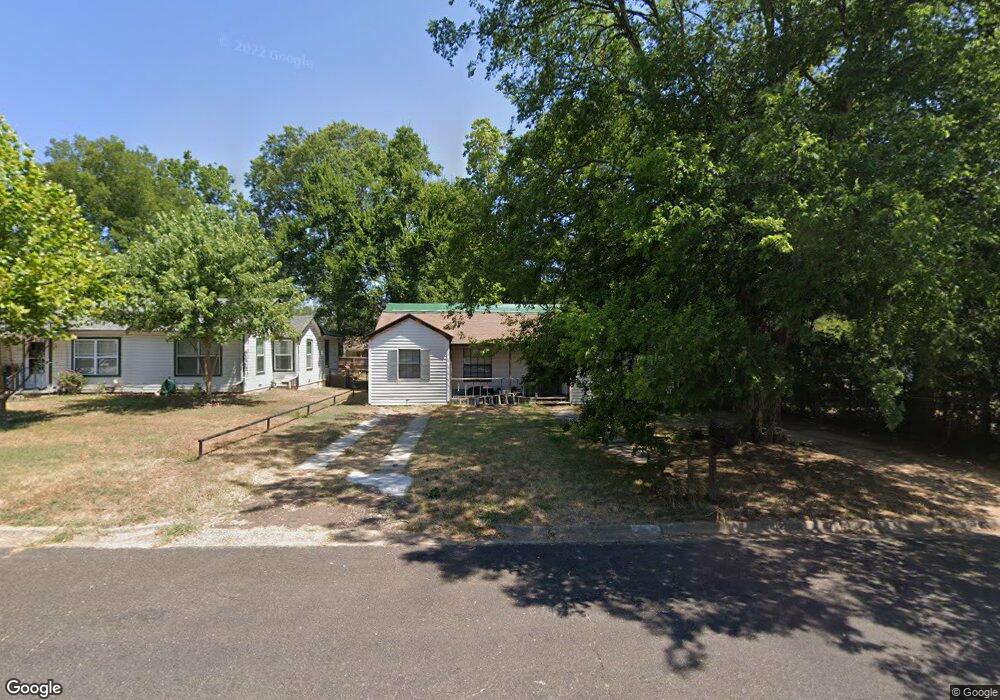
711 Turner St Kilgore, TX 75662
Estimated Value: $114,000 - $146,292
--
Bed
--
Bath
1,142
Sq Ft
$115/Sq Ft
Est. Value
About This Home
This home is located at 711 Turner St, Kilgore, TX 75662 and is currently estimated at $131,823, approximately $115 per square foot. 711 Turner St is a home located in Rusk County with nearby schools including Kilgore Primary School, Chandler Elementary School, and Kilgore Intermediate School.
Ownership History
Date
Name
Owned For
Owner Type
Purchase Details
Closed on
Mar 27, 2021
Sold by
Single Wing Llc Series Sw A
Bought by
Jackson Charles and Jackson Ginger R
Current Estimated Value
Home Financials for this Owner
Home Financials are based on the most recent Mortgage that was taken out on this home.
Original Mortgage
$62,000
Outstanding Balance
$54,769
Interest Rate
2.9%
Mortgage Type
Purchase Money Mortgage
Estimated Equity
$77,054
Purchase Details
Closed on
Jan 3, 2018
Sold by
Ashley Mildred A
Bought by
Single Wing Llc
Create a Home Valuation Report for This Property
The Home Valuation Report is an in-depth analysis detailing your home's value as well as a comparison with similar homes in the area
Home Values in the Area
Average Home Value in this Area
Purchase History
| Date | Buyer | Sale Price | Title Company |
|---|---|---|---|
| Jackson Charles | -- | None Available | |
| Single Wing Llc | $49,000 | None Available |
Source: Public Records
Mortgage History
| Date | Status | Borrower | Loan Amount |
|---|---|---|---|
| Open | Jackson Charles | $62,000 |
Source: Public Records
Tax History Compared to Growth
Tax History
| Year | Tax Paid | Tax Assessment Tax Assessment Total Assessment is a certain percentage of the fair market value that is determined by local assessors to be the total taxable value of land and additions on the property. | Land | Improvement |
|---|---|---|---|---|
| 2024 | $2,153 | $93,610 | $25,000 | $68,610 |
| 2023 | $2,068 | $84,050 | $10,000 | $74,050 |
| 2022 | $2,078 | $76,390 | $10,000 | $66,390 |
| 2021 | $1,644 | $64,750 | $10,000 | $54,750 |
| 2020 | $1,645 | $64,750 | $10,000 | $54,750 |
| 2019 | $1,687 | $64,750 | $10,000 | $54,750 |
| 2018 | $1,726 | $64,750 | $10,000 | $54,750 |
| 2017 | $1,667 | $64,750 | $10,000 | $54,750 |
| 2016 | $1,667 | $64,750 | $10,000 | $54,750 |
| 2015 | -- | $64,750 | $10,000 | $54,750 |
| 2014 | -- | $63,750 | $10,000 | $53,750 |
Source: Public Records
Map
Nearby Homes