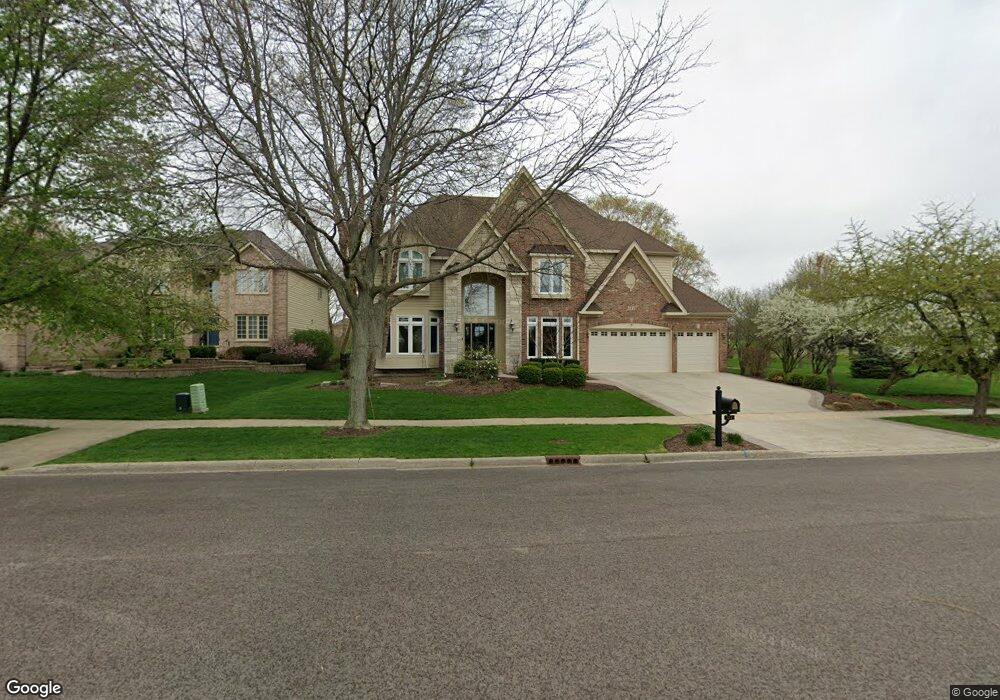
711 Twin Elms Ln Batavia, IL 60510
Nelson Lake NeighborhoodEstimated Value: $788,573 - $806,000
4
Beds
5
Baths
3,827
Sq Ft
$208/Sq Ft
Est. Value
About This Home
This home is located at 711 Twin Elms Ln, Batavia, IL 60510 and is currently estimated at $797,191, approximately $208 per square foot. 711 Twin Elms Ln is a home located in Kane County with nearby schools including Grace McWayne Elementary School, Sam Rotolo Middle School, and Batavia Sr High School.
Ownership History
Date
Name
Owned For
Owner Type
Purchase Details
Closed on
Jul 11, 2007
Sold by
Cowie Michael J and Cowie Virginia A
Bought by
Johnson Ii Gerald E and Johnson Stephanie M
Current Estimated Value
Home Financials for this Owner
Home Financials are based on the most recent Mortgage that was taken out on this home.
Original Mortgage
$483,988
Interest Rate
5.62%
Mortgage Type
Purchase Money Mortgage
Purchase Details
Closed on
Jun 25, 2004
Sold by
Grant Traci
Bought by
Cowie Michael J and Cowie Virginia A
Home Financials for this Owner
Home Financials are based on the most recent Mortgage that was taken out on this home.
Original Mortgage
$425,000
Interest Rate
5%
Mortgage Type
Purchase Money Mortgage
Purchase Details
Closed on
Oct 5, 2002
Sold by
Grant Jeff
Bought by
Grant Traci
Purchase Details
Closed on
Aug 1, 2001
Sold by
Oliver Hoffmann Corp
Bought by
Grant Jeff and Grant Traci
Home Financials for this Owner
Home Financials are based on the most recent Mortgage that was taken out on this home.
Original Mortgage
$510,800
Interest Rate
7%
Create a Home Valuation Report for This Property
The Home Valuation Report is an in-depth analysis detailing your home's value as well as a comparison with similar homes in the area
Home Values in the Area
Average Home Value in this Area
Purchase History
| Date | Buyer | Sale Price | Title Company |
|---|---|---|---|
| Johnson Ii Gerald E | $555,000 | M G R Title | |
| Cowie Michael J | $625,000 | Multiple | |
| Grant Traci | -- | -- | |
| Grant Jeff | $521,000 | Chicago Title Insurance Co |
Source: Public Records
Mortgage History
| Date | Status | Borrower | Loan Amount |
|---|---|---|---|
| Previous Owner | Johnson Ii Gerald E | $483,988 | |
| Previous Owner | Cowie Michael J | $425,000 | |
| Previous Owner | Grant Jeff | $510,800 |
Source: Public Records
Tax History Compared to Growth
Tax History
| Year | Tax Paid | Tax Assessment Tax Assessment Total Assessment is a certain percentage of the fair market value that is determined by local assessors to be the total taxable value of land and additions on the property. | Land | Improvement |
|---|---|---|---|---|
| 2024 | $17,838 | $225,616 | $16,274 | $209,342 |
| 2023 | $17,571 | $204,770 | $14,770 | $190,000 |
| 2022 | $16,187 | $191,374 | $13,804 | $177,570 |
| 2021 | $15,558 | $181,501 | $13,092 | $168,409 |
| 2020 | $16,111 | $188,555 | $12,840 | $175,715 |
| 2019 | $15,862 | $181,880 | $12,385 | $169,495 |
| 2018 | $16,018 | $183,533 | $11,913 | $171,620 |
| 2017 | $15,645 | $177,481 | $11,520 | $165,961 |
| 2016 | $15,324 | $172,311 | $11,184 | $161,127 |
| 2015 | -- | $168,387 | $10,929 | $157,458 |
| 2014 | -- | $174,566 | $10,585 | $163,981 |
| 2013 | -- | $172,990 | $12,209 | $160,781 |
Source: Public Records
Map
Nearby Homes
- 218 Weirich Way Unit 88001
- 116 Furnas Dr
- 119 Furnas Dr
- 143 Furnas Dr
- 131 Furnas Dr
- 128 Furnas Dr
- 33 Weirich Way Unit 77004
- 41 Weirich Way Unit 77005
- 146 Furnas Dr
- 125 Furnas Dr
- 0000 Sec of Kirk Road and Wind Energy Pass
- 2542 Williams Rd Unit 1
- 112 S Barton Trail Unit 112
- 1375 Green Pheasant Ln
- 931 Lusted Ln
- 843 Alberosky Way Unit 3
- 2814 Hapner Way
- 803 Millview Dr
- 2918 Hapner Way
- 384 Danforth Dr
- 727 Twin Elms Ln
- 749 Twin Elms Ln
- 2210 Bird Ln
- 722 Twin Elms Ln
- 763 Twin Elms Ln
- 2238 Bird Ln Unit I
- 758 Twin Elms Ln Unit 1
- 785 Twin Elms Ln
- 2256 Bird Ln
- 2227 Bird Ln
- 601 Twin Elms Ln
- 764 Twin Elms Ln Unit 1
- 596 Twin Elms Ln
- 2241 Bird Ln
- 2274 Bird Ln
- 831 Twin Elms Ln
- 796 Twin Elms Ln
- 2263 Bird Ln
- 508 Twin Elms Ln
- 2292 Bird Ln