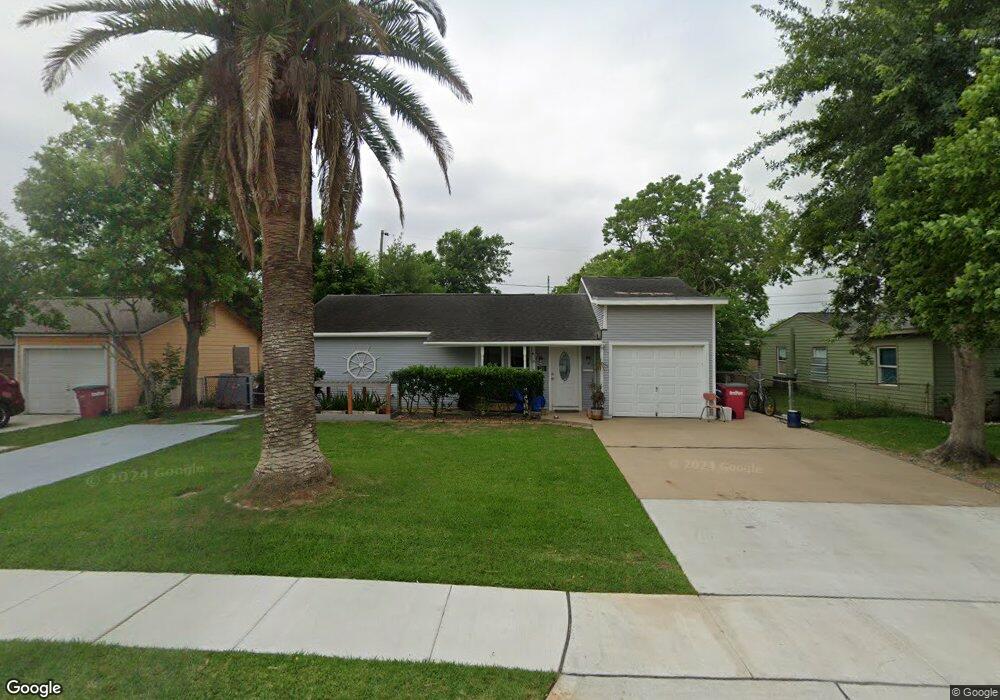
711 W 10th St Freeport, TX 77541
Estimated Value: $144,000 - $161,000
Studio
1
Bath
1,255
Sq Ft
$123/Sq Ft
Est. Value
About This Home
This home is located at 711 W 10th St, Freeport, TX 77541 and is currently estimated at $154,249, approximately $122 per square foot. 711 W 10th St is a home located in Brazoria County with nearby schools including O'Hara Lanier Middle School, Freeport Intermediate School, and Brazosport High School.
Ownership History
Date
Name
Owned For
Owner Type
Purchase Details
Closed on
Oct 7, 2014
Sold by
Jiminez Juan and Caraveo Maria Lourdas
Bought by
Jiminez Julian A and Jiminez Michelle
Current Estimated Value
Purchase Details
Closed on
Sep 1, 1995
Sold by
Hulsopple Donald L and Hulsopple Ella Jane
Bought by
Jiminez Juan and Caraveo Maria Lourdes
Home Financials for this Owner
Home Financials are based on the most recent Mortgage that was taken out on this home.
Original Mortgage
$17,750
Interest Rate
7.6%
Mortgage Type
Seller Take Back
Create a Home Valuation Report for This Property
The Home Valuation Report is an in-depth analysis detailing your home's value as well as a comparison with similar homes in the area
Home Values in the Area
Average Home Value in this Area
Purchase History
| Date | Buyer | Sale Price | Title Company |
|---|---|---|---|
| Jiminez Julian A | -- | None Available | |
| Jiminez Juan | -- | -- |
Source: Public Records
Mortgage History
| Date | Status | Borrower | Loan Amount |
|---|---|---|---|
| Previous Owner | Jiminez Juan | $17,750 |
Source: Public Records
Tax History
| Year | Tax Paid | Tax Assessment Tax Assessment Total Assessment is a certain percentage of the fair market value that is determined by local assessors to be the total taxable value of land and additions on the property. | Land | Improvement |
|---|---|---|---|---|
| 2025 | $1,012 | $120,256 | $20,130 | $128,060 |
| 2023 | $1,012 | $99,385 | $13,880 | $145,080 |
| 2022 | $2,231 | $90,350 | $4,580 | $132,440 |
| 2021 | $2,140 | $102,380 | $4,580 | $97,800 |
| 2020 | $1,981 | $97,730 | $4,580 | $93,150 |
| 2019 | $1,856 | $86,600 | $4,580 | $82,020 |
| 2018 | $1,698 | $61,710 | $4,580 | $57,130 |
| 2017 | $1,702 | $61,710 | $4,580 | $57,130 |
| 2016 | $1,626 | $72,710 | $4,580 | $68,130 |
| 2015 | $998 | $53,600 | $4,580 | $49,020 |
| 2014 | $998 | $49,360 | $4,580 | $44,780 |
Source: Public Records
Map
Nearby Homes
Your Personal Tour Guide
Ask me questions while you tour the home.