Estimated Value: $596,000 - $655,000
--
Bed
--
Bath
2,397
Sq Ft
$261/Sq Ft
Est. Value
About This Home
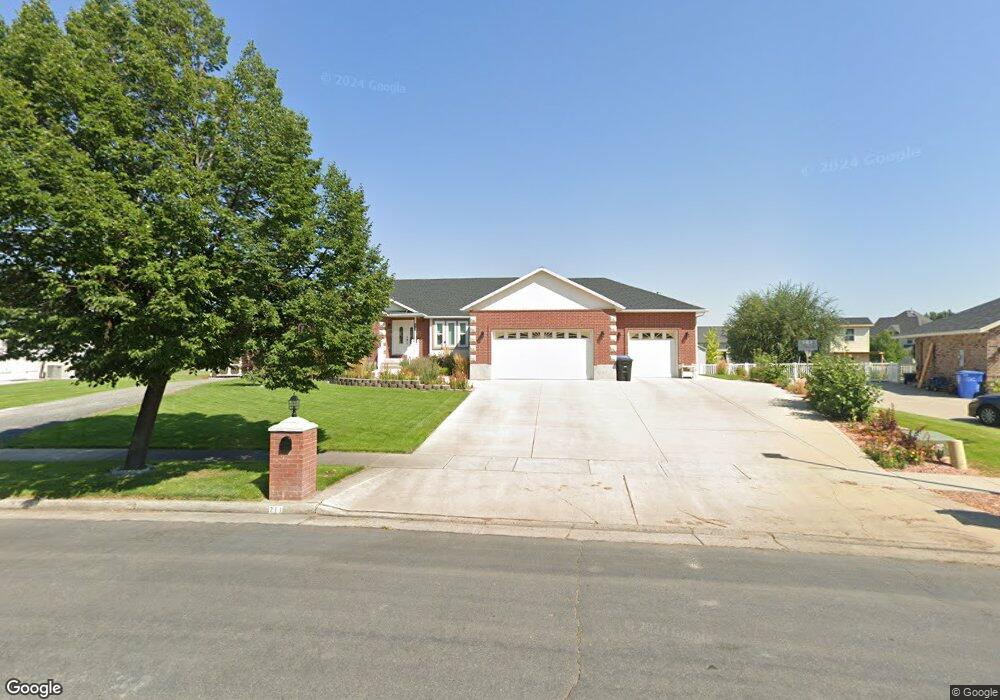
This home is located at 711 W 2475 S, Logan, UT 84321 and is currently estimated at $626,198, approximately $261 per square foot. 711 W 2475 S is a home with nearby schools including Nibley School, Spring Creek Middle School, and South Cache Middle School.
Ownership History
Date
Name
Owned For
Owner Type
Purchase Details
Closed on
Aug 21, 2024
Sold by
Nielsen Dennis and Nielsen Tina
Bought by
Dennis And Tina Nielsen Living Trust and Nielsen
Current Estimated Value
Purchase Details
Closed on
Jun 1, 2022
Sold by
Nelson Family Trust
Bought by
Nielsen Dennis and Nielsen Tina
Purchase Details
Closed on
Oct 12, 2001
Sold by
Landmark Homes & Development Inc
Bought by
Nelson H Jay and Nelson Vellys H
Create a Home Valuation Report for This Property
The Home Valuation Report is an in-depth analysis detailing your home's value as well as a comparison with similar homes in the area
Home Values in the Area
Average Home Value in this Area
Purchase History
| Date | Buyer | Sale Price | Title Company |
|---|---|---|---|
| Dennis And Tina Nielsen Living Trust | -- | None Listed On Document | |
| Nielsen Dennis | -- | None Listed On Document | |
| Nelson H Jay | -- | Cache Title Company |
Source: Public Records
Tax History Compared to Growth
Tax History
| Year | Tax Paid | Tax Assessment Tax Assessment Total Assessment is a certain percentage of the fair market value that is determined by local assessors to be the total taxable value of land and additions on the property. | Land | Improvement |
|---|---|---|---|---|
| 2025 | $2,746 | $363,950 | $0 | $0 |
| 2024 | $2,637 | $328,185 | $0 | $0 |
| 2023 | $2,776 | $323,450 | $0 | $0 |
| 2022 | $2,889 | $323,450 | $0 | $0 |
| 2021 | $2,797 | $486,290 | $79,100 | $407,190 |
| 2020 | $2,600 | $430,391 | $79,100 | $351,291 |
| 2019 | $2,727 | $430,390 | $79,100 | $351,290 |
| 2018 | $2,348 | $361,470 | $56,000 | $305,470 |
| 2017 | $2,250 | $183,535 | $0 | $0 |
| 2016 | $2,275 | $183,535 | $0 | $0 |
| 2015 | $1,931 | $156,725 | $0 | $0 |
| 2014 | $1,887 | $156,725 | $0 | $0 |
| 2013 | -- | $161,960 | $0 | $0 |
Source: Public Records
Map
Nearby Homes
- 2269 Clear Creek Rd
- 2615 S 600 W
- 2616 S 900 W
- 2680 S 600 W
- 1045 W 2400 S
- 2271 S 1050 W
- 2271 S 1050 W Unit 96
- 3074 S 800 W
- 2313 S 1000 W Unit 110
- 3308 S 1000 W
- 3318 S 1000 W
- 1140 2260 S
- 2237 S 1150 W Unit 39
- 2938 S 600 W
- 1254 W 2401 S
- 2882 S 1080 W
- 2485 S 1296 W
- 907 W 2980 S
- 2814 S 1150 W
- 1177 W 1960 S