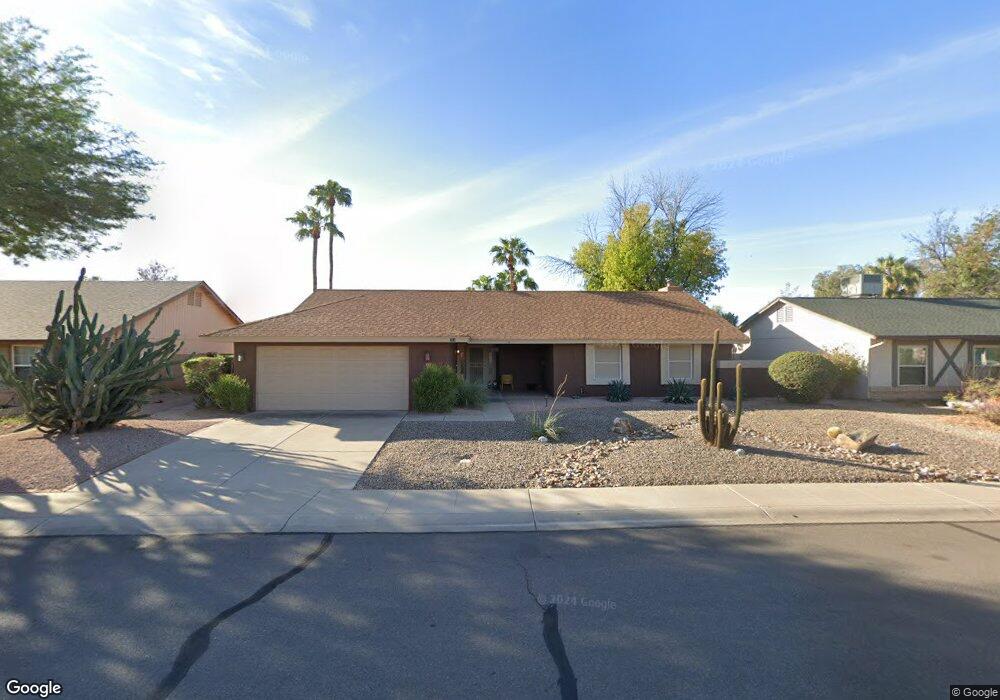
711 W Bentrup St Chandler, AZ 85225
Amberwood NeighborhoodEstimated Value: $409,718 - $523,000
--
Bed
2
Baths
1,827
Sq Ft
$269/Sq Ft
Est. Value
About This Home
This home is located at 711 W Bentrup St, Chandler, AZ 85225 and is currently estimated at $491,680, approximately $269 per square foot. 711 W Bentrup St is a home located in Maricopa County with nearby schools including Sirrine Elementary School, Franklin at Brimhall Elementary School, and Summit Academy Elementary.
Ownership History
Date
Name
Owned For
Owner Type
Purchase Details
Closed on
Jan 10, 2007
Sold by
Lawson John R and Lawson Angela M
Bought by
Price Robert Glen
Current Estimated Value
Purchase Details
Closed on
Nov 22, 1995
Sold by
Mccarthy James and Mccarthy Judith E
Bought by
Ramacciato Joseph P and Ramacciato Anita
Home Financials for this Owner
Home Financials are based on the most recent Mortgage that was taken out on this home.
Original Mortgage
$96,350
Interest Rate
7.51%
Mortgage Type
New Conventional
Purchase Details
Closed on
Jul 15, 1994
Sold by
Associates Financial Services Co Of Ariz
Bought by
Mccarthy James and Mccarthy Judy
Home Financials for this Owner
Home Financials are based on the most recent Mortgage that was taken out on this home.
Original Mortgage
$100,000
Interest Rate
8.25%
Mortgage Type
New Conventional
Create a Home Valuation Report for This Property
The Home Valuation Report is an in-depth analysis detailing your home's value as well as a comparison with similar homes in the area
Home Values in the Area
Average Home Value in this Area
Purchase History
| Date | Buyer | Sale Price | Title Company |
|---|---|---|---|
| Price Robert Glen | -- | Transnation Title Ins Co | |
| Ramacciato Joseph P | $120,500 | -- | |
| Mccarthy James | $100,000 | Security Title Agency |
Source: Public Records
Mortgage History
| Date | Status | Borrower | Loan Amount |
|---|---|---|---|
| Previous Owner | Ramacciato Joseph P | $96,350 | |
| Previous Owner | Mccarthy James | $100,000 |
Source: Public Records
Tax History Compared to Growth
Tax History
| Year | Tax Paid | Tax Assessment Tax Assessment Total Assessment is a certain percentage of the fair market value that is determined by local assessors to be the total taxable value of land and additions on the property. | Land | Improvement |
|---|---|---|---|---|
| 2025 | $1,670 | $19,623 | -- | -- |
| 2024 | $1,689 | $18,689 | -- | -- |
| 2023 | $1,689 | $36,510 | $7,300 | $29,210 |
| 2022 | $1,643 | $27,660 | $5,530 | $22,130 |
| 2021 | $1,652 | $25,670 | $5,130 | $20,540 |
| 2020 | $1,634 | $23,010 | $4,600 | $18,410 |
| 2019 | $1,505 | $21,520 | $4,300 | $17,220 |
| 2018 | $1,461 | $19,880 | $3,970 | $15,910 |
| 2017 | $1,405 | $18,710 | $3,740 | $14,970 |
| 2016 | $1,374 | $18,150 | $3,630 | $14,520 |
| 2015 | $1,293 | $15,460 | $3,090 | $12,370 |
Source: Public Records
Map
Nearby Homes
- 707 W Bentrup St
- 915 W Loughlin Dr
- 1126 W Elliot Rd Unit 1040
- 1111 W Summit Place Unit 62
- 2609 N Pleasant Dr
- 3412 N Hartford St
- 1203 W Alamo Dr
- 2900 N Nebraska St
- 638 W Barrow Dr
- 2603 N Hartford St
- 693 W Barrow Dr
- 3104 N Seneca Ct
- 400 W Crofton St
- 3470 N Apache Ct Unit 4
- 1335 W Straford Dr
- 2970 N Oregon St Unit 10
- 2986 N Oregon St Unit 7
- 2954 N Oregon St Unit 6
- 740 W Posada Ave
- 305 W Nopal Place
- 803 W Bentrup St
- 709 W Bentrup St
- 805 W Bentrup St
- 712 W Bentrup St
- 800 W Bentrup St
- 807 W Bentrup St
- 705 W Bentrup St
- 802 W Bentrup St
- 704 W Bentrup St
- 710 W Bentrup St
- 809 W Bentrup St
- 806 W Bentrup St
- 703 W Bentrup St
- 702 W Bentrup St
- 708 W Bentrup St
- 711 W Mcnair St
- 713 W Mcnair St
- 706 W Bentrup St
- 709 W Mcnair St Unit 4
- 805 W Mcnair St