711 W Broad St Griffin, GA 30223
Spalding County NeighborhoodEstimated payment $172/month
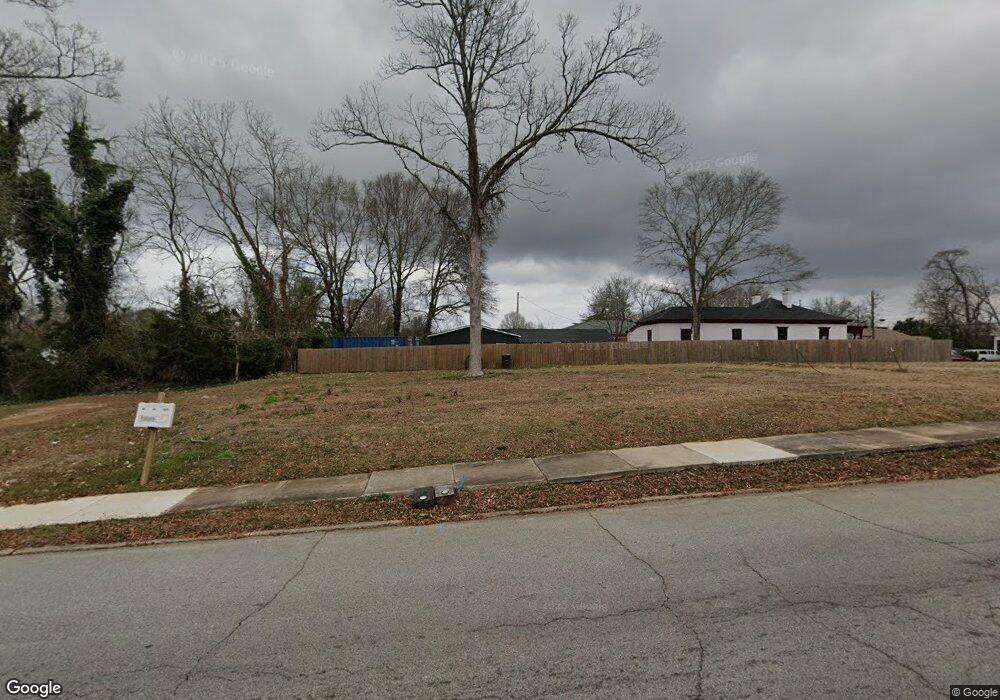
About This Lot
711 / 715 W Broad St 30223 $30,000 - previously a duplex; City Planning & Zoning Department says they can be rebuilt at a similar size. Must be verified by the city.; we have already attempted to divide/parcel out the land, but Planning & Zoning denied; a survey from when the previous home existed is included in the price; the home was cleared last year..49 acres
Property Details
Property Type
- Land
Est. Annual Taxes
- $170
Lot Details
- 0.4 Acre Lot
- Lot Dimensions are 205 x 86
- Cleared Lot
- Property is zoned MDR
Property Views
- City Views
Utilities
- Phone Available
- Cable TV Available
Listing and Financial Details
- Assessor Parcel Number 011 07003
Map
Home Values in the Area
Average Home Value in this Area
Tax History
| Year | Tax Paid | Tax Assessment Tax Assessment Total Assessment is a certain percentage of the fair market value that is determined by local assessors to be the total taxable value of land and additions on the property. | Land | Improvement |
|---|---|---|---|---|
| 2024 | $170 | $4,440 | $4,320 | $120 |
| 2023 | $170 | $15,366 | $4,320 | $11,046 |
| 2022 | $522 | $15,366 | $4,320 | $11,046 |
| 2021 | $587 | $14,677 | $4,320 | $10,357 |
| 2020 | $560 | $14,677 | $4,320 | $10,357 |
| 2019 | $570 | $13,995 | $4,320 | $9,675 |
| 2018 | $599 | $14,189 | $4,320 | $9,869 |
| 2017 | $587 | $14,189 | $4,320 | $9,869 |
| 2016 | $596 | $14,189 | $4,320 | $9,869 |
| 2015 | $606 | $14,189 | $4,320 | $9,869 |
| 2014 | $624 | $14,189 | $4,320 | $9,869 |
Property History
| Date | Event | Price | List to Sale | Price per Sq Ft |
|---|---|---|---|---|
| 07/21/2025 07/21/25 | For Sale | $30,000 | -- | -- |
Purchase History
| Date | Type | Sale Price | Title Company |
|---|---|---|---|
| Quit Claim Deed | -- | -- | |
| Limited Warranty Deed | $862,810 | -- | |
| Limited Warranty Deed | $670 | -- | |
| Warranty Deed | -- | -- | |
| Limited Warranty Deed | $215,000 | -- | |
| Deed | -- | -- | |
| Deed | -- | -- |
Source: First Multiple Listing Service (FMLS)
MLS Number: 7619352
APN: 011-07-003
Disclaimer: Certain information contained herein is derived from information provided by parties other than Homes.com. All information provided is deemed reliable, but is not guaranteed to be accurate and should be independently verified.
![]() Listings identified with the FMLS IDX logo come from FMLS and are held by brokerage firms other than the owner of this website. The listing brokerage is identified in any listing details. Information is deemed reliable but is not guaranteed. If you believe any FMLS listing contains material that infringes your copyrighted work please visit www.fmls.com/dmca to review our DMCA policy and learn how to submit a takedown request. © 2025 First Multiple Listing Service, Inc.
Listings identified with the FMLS IDX logo come from FMLS and are held by brokerage firms other than the owner of this website. The listing brokerage is identified in any listing details. Information is deemed reliable but is not guaranteed. If you believe any FMLS listing contains material that infringes your copyrighted work please visit www.fmls.com/dmca to review our DMCA policy and learn how to submit a takedown request. © 2025 First Multiple Listing Service, Inc.
- 733 W Broad St
- 116 N 14th St
- 108 N 14th St
- 737 W Solomon St
- 332 N 14th St
- 822 W Solomon St
- 318 N 15th St
- 830 Ray St
- 1017 W Broad St
- 1025 W Broad St
- 629 Williams St
- 312.37 AC W Ellis Rd
- 200 AC W Ellis Rd
- 915 W Poplar St
- 1106 Wright St
- 411 Palace St
- 354 N 17th St
- 525 W Quilly St
- 320 S 12th St
- 417 N 16th St
- 502 W Broadway St
- 617 Meriwether St
- 360 N 19th St Unit E
- 1110 W Poplar St
- 358 N 19th St Unit H
- 115 W Tinsley St Unit A
- 115 W Tinsley St Unit B
- 115 W Tinsley St
- 108 Ohoopee Dr
- 1247 Cherokee Ave
- 106 E Cherry St
- 2 Cedar Ave
- 438 N 5th St
- 113-135 West Ave
- 83 Elm St
- 829 N Hill St
- 1569 Georgia Highway 16 W
- 1560 Flynt St
- 708 S Hill St Unit APARTMENT
- 512 Elles Way
