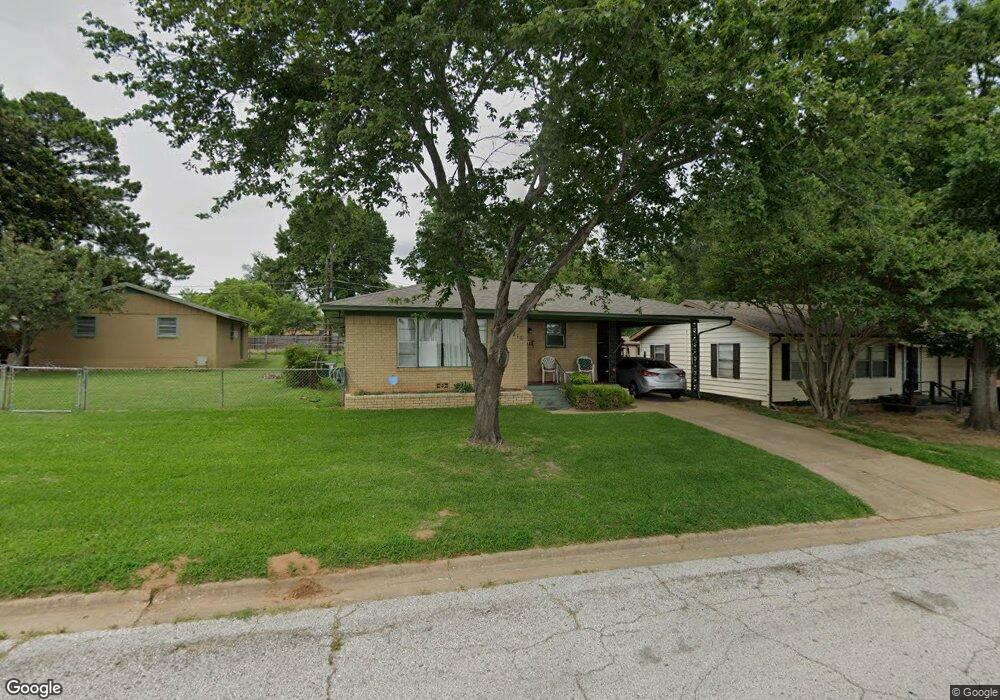
711 W Brock St Denison, TX 75020
Estimated Value: $180,757 - $191,000
--
Bed
--
Bath
1,348
Sq Ft
$138/Sq Ft
Est. Value
About This Home
This home is located at 711 W Brock St, Denison, TX 75020 and is currently estimated at $185,879, approximately $137 per square foot. 711 W Brock St is a home located in Grayson County with nearby schools including Scott Middle School, Denison High School, and St. Luke's Parish Day School.
Ownership History
Date
Name
Owned For
Owner Type
Purchase Details
Closed on
Feb 3, 2020
Sold by
Napier Rodger G
Bought by
Davila Laura E
Current Estimated Value
Create a Home Valuation Report for This Property
The Home Valuation Report is an in-depth analysis detailing your home's value as well as a comparison with similar homes in the area
Home Values in the Area
Average Home Value in this Area
Purchase History
| Date | Buyer | Sale Price | Title Company |
|---|---|---|---|
| Davila Laura E | -- | None Available |
Source: Public Records
Tax History Compared to Growth
Tax History
| Year | Tax Paid | Tax Assessment Tax Assessment Total Assessment is a certain percentage of the fair market value that is determined by local assessors to be the total taxable value of land and additions on the property. | Land | Improvement |
|---|---|---|---|---|
| 2025 | $671 | $165,526 | -- | -- |
| 2024 | $3,496 | $150,478 | $0 | $0 |
| 2023 | $671 | $136,798 | $0 | $0 |
| 2022 | $2,955 | $124,362 | $0 | $0 |
| 2021 | $2,851 | $113,056 | $18,240 | $94,816 |
| 2020 | $2,766 | $107,465 | $18,240 | $89,225 |
| 2019 | $2,623 | $105,813 | $13,920 | $91,893 |
| 2018 | $2,404 | $97,737 | $11,520 | $86,217 |
| 2017 | $2,204 | $83,190 | $8,760 | $74,430 |
| 2016 | $2,004 | $82,857 | $8,760 | $74,097 |
| 2015 | $1,401 | $65,113 | $8,760 | $56,353 |
| 2014 | $1,551 | $65,113 | $8,760 | $56,353 |
Source: Public Records
Map
Nearby Homes
- 736 W Bullock St
- 2560 S Scullin Ave
- 709 W Hanna St
- 617 W Bullock St
- 1016 W Hanna St
- 1023 W Bullock St
- 908 W Murray St
- 517 W Bullock St
- 525 W Hanna St
- 1031 W Acheson St
- 1044 W Ford St
- 928 W Chase St
- 1301 S Scullin Ave
- 509 W Acheson St
- 513 W Murray St
- 1210 W Bullock St
- 505 W Ford St
- 904 W Florence St
- 1927 S Fannin Ave
- 930 W Florence St
- 721 W Brock St
- 709 W Brock St
- 725 W Brock St
- 707 W Brock St
- 716 W Bullock St
- 714 W Bullock St
- 714 W Bullock St
- 727 W Brock St
- 724 W Bullock St
- 712 W Bullock St
- 701 W Brock St
- 732 W Bullock St
- 733 W Brock St
- 700 W Bullock St
- 737 W Brock St
- 740 W Bullock St
- 721 W Bullock St
- 719 W Bullock St
- 723 W Bullock St
- 715 W Bullock St