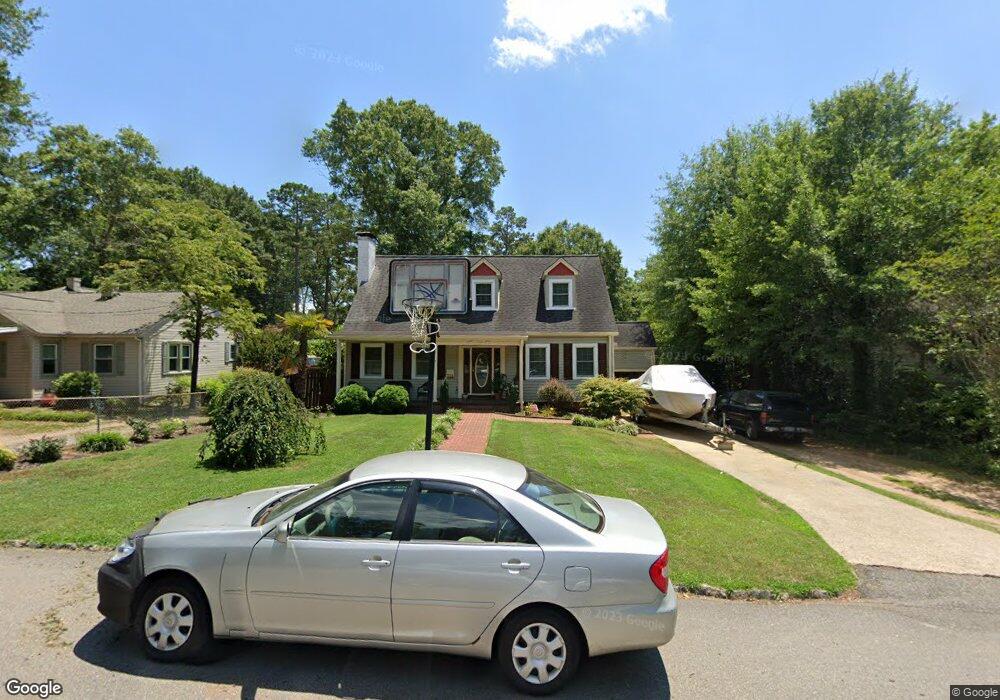
711 W Oak St Shelby, NC 28150
Estimated Value: $205,159 - $280,000
3
Beds
2
Baths
1,750
Sq Ft
$138/Sq Ft
Est. Value
About This Home
This home is located at 711 W Oak St, Shelby, NC 28150 and is currently estimated at $242,040, approximately $138 per square foot. 711 W Oak St is a home located in Cleveland County with nearby schools including Graham Elementary School, Shelby Middle School, and Shelby High School.
Ownership History
Date
Name
Owned For
Owner Type
Purchase Details
Closed on
May 9, 2011
Sold by
Fannie Mae
Bought by
Enste Russell and Enste Loraine
Current Estimated Value
Purchase Details
Closed on
Apr 19, 2010
Sold by
Hall Suzanne H
Bought by
Federal National Mortgage Association
Create a Home Valuation Report for This Property
The Home Valuation Report is an in-depth analysis detailing your home's value as well as a comparison with similar homes in the area
Home Values in the Area
Average Home Value in this Area
Purchase History
| Date | Buyer | Sale Price | Title Company |
|---|---|---|---|
| Enste Russell | -- | None Available | |
| Federal National Mortgage Association | $84,200 | None Available |
Source: Public Records
Tax History Compared to Growth
Tax History
| Year | Tax Paid | Tax Assessment Tax Assessment Total Assessment is a certain percentage of the fair market value that is determined by local assessors to be the total taxable value of land and additions on the property. | Land | Improvement |
|---|---|---|---|---|
| 2025 | $2,256 | $226,727 | $11,700 | $215,027 |
| 2024 | $1,031 | $83,476 | $3,900 | $79,576 |
| 2023 | $1,026 | $83,476 | $3,900 | $79,576 |
| 2022 | $1,026 | $83,476 | $3,900 | $79,576 |
| 2021 | $1,031 | $83,476 | $3,900 | $79,576 |
| 2020 | $608 | $47,166 | $3,900 | $43,266 |
| 2019 | $608 | $47,166 | $3,900 | $43,266 |
| 2018 | $607 | $47,166 | $3,900 | $43,266 |
| 2017 | $592 | $47,166 | $3,900 | $43,266 |
| 2016 | $593 | $47,166 | $3,900 | $43,266 |
| 2015 | $907 | $76,912 | $3,900 | $73,012 |
| 2014 | $907 | $76,912 | $3,900 | $73,012 |
Source: Public Records
Map
Nearby Homes