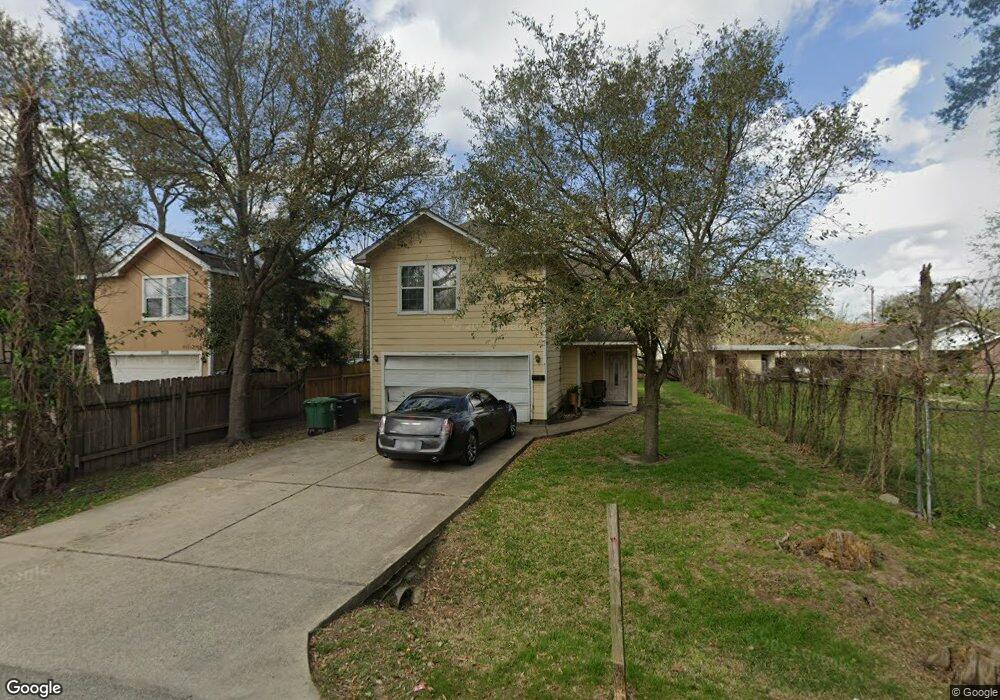
711 Warner St Houston, TX 77022
Northside-Northline NeighborhoodEstimated Value: $252,325 - $285,000
3
Beds
3
Baths
1,570
Sq Ft
$176/Sq Ft
Est. Value
About This Home
This home is located at 711 Warner St, Houston, TX 77022 and is currently estimated at $276,581, approximately $176 per square foot. 711 Warner St is a home located in Harris County with nearby schools including Burbank Elementary School, Burbank Middle School, and Sam Houston Math, Science & Technology Center.
Ownership History
Date
Name
Owned For
Owner Type
Purchase Details
Closed on
Dec 26, 2006
Sold by
Martinez Jose
Bought by
Hill Cole and Thomas Denise R
Current Estimated Value
Home Financials for this Owner
Home Financials are based on the most recent Mortgage that was taken out on this home.
Original Mortgage
$104,394
Outstanding Balance
$62,351
Interest Rate
6.2%
Mortgage Type
Purchase Money Mortgage
Estimated Equity
$214,230
Purchase Details
Closed on
Jan 31, 2006
Sold by
Mrl Family Trust
Bought by
Martinez Jose
Create a Home Valuation Report for This Property
The Home Valuation Report is an in-depth analysis detailing your home's value as well as a comparison with similar homes in the area
Home Values in the Area
Average Home Value in this Area
Purchase History
| Date | Buyer | Sale Price | Title Company |
|---|---|---|---|
| Hill Cole | -- | Fidelity National Title | |
| Martinez Jose | -- | Fidelity National Title |
Source: Public Records
Mortgage History
| Date | Status | Borrower | Loan Amount |
|---|---|---|---|
| Open | Hill Cole | $104,394 |
Source: Public Records
Tax History Compared to Growth
Tax History
| Year | Tax Paid | Tax Assessment Tax Assessment Total Assessment is a certain percentage of the fair market value that is determined by local assessors to be the total taxable value of land and additions on the property. | Land | Improvement |
|---|---|---|---|---|
| 2025 | $4,362 | $245,623 | $81,320 | $164,303 |
| 2024 | $4,362 | $208,465 | $74,633 | $133,832 |
| 2023 | $4,362 | $258,899 | $45,475 | $213,424 |
| 2022 | $4,708 | $213,829 | $45,475 | $168,354 |
| 2021 | $5,164 | $221,584 | $45,475 | $176,109 |
| 2020 | $4,892 | $202,013 | $45,475 | $156,538 |
| 2019 | $5,198 | $205,438 | $37,450 | $167,988 |
| 2018 | $3,678 | $145,338 | $31,298 | $114,040 |
| 2017 | $3,675 | $145,338 | $31,298 | $114,040 |
| 2016 | $3,018 | $119,355 | $29,425 | $89,930 |
| 2015 | $2,418 | $94,069 | $21,400 | $72,669 |
| 2014 | $2,418 | $94,069 | $21,400 | $72,669 |
Source: Public Records
Map
Nearby Homes
- 807 Firnat St
- 723 Doverside St
- 9026 Mcgallion Rd
- 1207 Firnat St
- 702 Pennington St
- 88 Berry Rd
- 8411 Berry Brush Ln
- 8402 Berry Green Ln
- 802 Berry Sage Ln
- 411 Berry Rd
- 1104 Charnwood St
- 318 Charlock St
- 8205 Appleton St
- 253 De Boll St
- 249 De Boll St
- 631 Apache St
- 216 Burress St
- 743 Apache St
- 714 Apache St
- 0 Appleton St