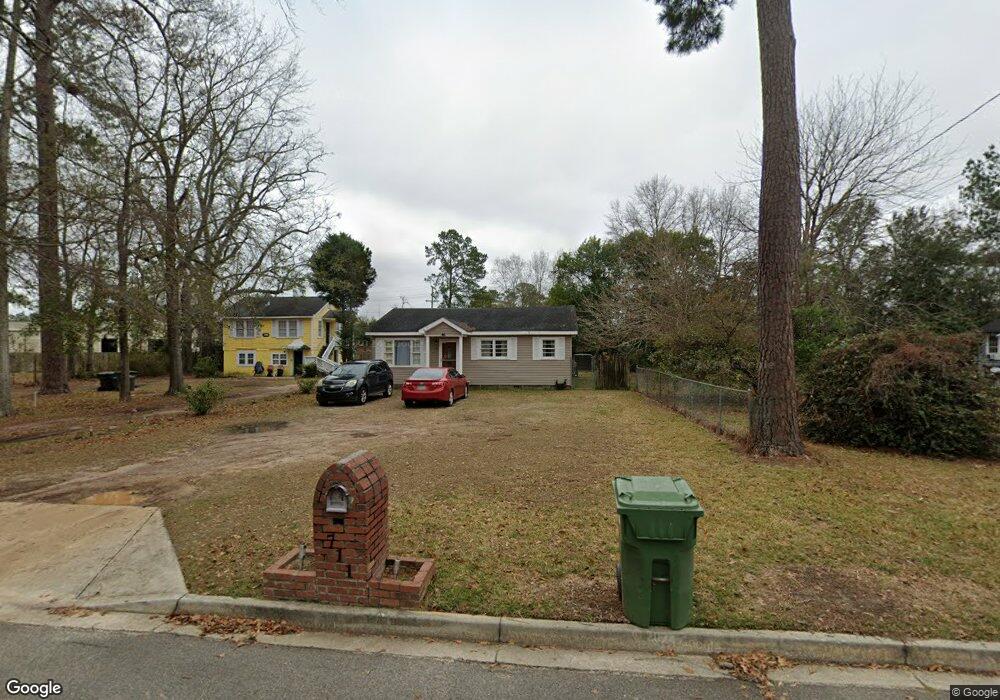
711 Westover Ave Thomasville, GA 31792
Estimated Value: $177,000 - $231,000
--
Bed
2
Baths
1,479
Sq Ft
$138/Sq Ft
Est. Value
About This Home
This home is located at 711 Westover Ave, Thomasville, GA 31792 and is currently estimated at $203,989, approximately $137 per square foot. 711 Westover Ave is a home located in Thomas County with nearby schools including Thomasville High School, Brookwood School, and World of Truth Christian Academy.
Ownership History
Date
Name
Owned For
Owner Type
Purchase Details
Closed on
Dec 22, 2020
Sold by
Thomas Travis
Bought by
Thomas Danni Jessica
Current Estimated Value
Home Financials for this Owner
Home Financials are based on the most recent Mortgage that was taken out on this home.
Original Mortgage
$101,914
Outstanding Balance
$90,171
Interest Rate
2.7%
Mortgage Type
New Conventional
Estimated Equity
$113,818
Purchase Details
Closed on
Feb 17, 2015
Sold by
Thomas Travis
Bought by
Thomas Jacqueline
Purchase Details
Closed on
Apr 1, 2011
Sold by
Thomas Keith A
Bought by
Thomas Travis
Purchase Details
Closed on
Apr 23, 2002
Sold by
Thomasville Property Managemen
Bought by
Thomas Keith A and Posey Jackie R
Purchase Details
Closed on
Dec 28, 2000
Sold by
Cohen Ronald A
Bought by
Thomasville Property Management
Purchase Details
Closed on
Mar 17, 1989
Bought by
Cohen Ronald A
Create a Home Valuation Report for This Property
The Home Valuation Report is an in-depth analysis detailing your home's value as well as a comparison with similar homes in the area
Home Values in the Area
Average Home Value in this Area
Purchase History
| Date | Buyer | Sale Price | Title Company |
|---|---|---|---|
| Thomas Danni Jessica | $140,000 | -- | |
| Thomas Jacqueline | -- | -- | |
| Thomas Travis | -- | -- | |
| Thomas Keith A | $48,700 | -- | |
| Thomasville Property Management | $12,000 | -- | |
| Cohen Ronald A | $15,400 | -- |
Source: Public Records
Mortgage History
| Date | Status | Borrower | Loan Amount |
|---|---|---|---|
| Open | Thomas Danni Jessica | $101,914 |
Source: Public Records
Tax History Compared to Growth
Tax History
| Year | Tax Paid | Tax Assessment Tax Assessment Total Assessment is a certain percentage of the fair market value that is determined by local assessors to be the total taxable value of land and additions on the property. | Land | Improvement |
|---|---|---|---|---|
| 2024 | $1,193 | $49,491 | $2,208 | $47,283 |
| 2023 | $1,141 | $46,114 | $2,208 | $43,906 |
| 2022 | $377 | $40,060 | $1,920 | $38,140 |
| 2021 | $346 | $33,539 | $1,920 | $31,619 |
| 2020 | $270 | $25,660 | $1,920 | $23,740 |
| 2019 | $273 | $25,660 | $1,920 | $23,740 |
| 2018 | $273 | $25,425 | $1,920 | $23,505 |
| 2017 | $279 | $25,462 | $1,709 | $23,753 |
| 2016 | $271 | $24,718 | $1,709 | $23,010 |
| 2015 | $297 | $26,816 | $1,594 | $25,222 |
| 2014 | -- | $26,209 | $1,594 | $24,616 |
| 2013 | -- | $26,209 | $1,593 | $24,615 |
Source: Public Records
Map
Nearby Homes
- 1120 W Jackson St
- 365 W Shore Dr
- 209 Harris St
- 101 Hambleton St
- 610 Gribben St
- 515 Harris St
- 00 W Jackson St
- 925 W Jackson St
- 112 Horrix St
- 1104 Fletcher St
- 307 Varnedoe St
- 6358 S Us Hwy 319
- 108 Augusta Ave
- 803 Fletcher St
- 118 3rd Ave
- 110 Andrews St
- 120 3rd Ave
- 169 Acacia Blvd
- 1811 Fletcher St
- 119 Persimmon St
- 709 Westover Ave
- 106 Branch St
- 703 Westover Ave
- 712 Westover Ave
- 201 Fairfax St
- 716 Westover Ave
- 207 Fairfax St
- 1132 W Jackson St
- 709 Raleigh Ave
- 820 Westover Ave
- 705 Raleigh Ave
- 715 Raleigh Ave
- 618 Westover Ave
- 1165 W Jackson St
- 719 Raleigh Ave
- 0000 W West Jackson Street ( 98 Acres)
- 723 Raleigh Ave
- 614 Westover Ave
- 615 Raleigh Ave
- 301 Fairfax St