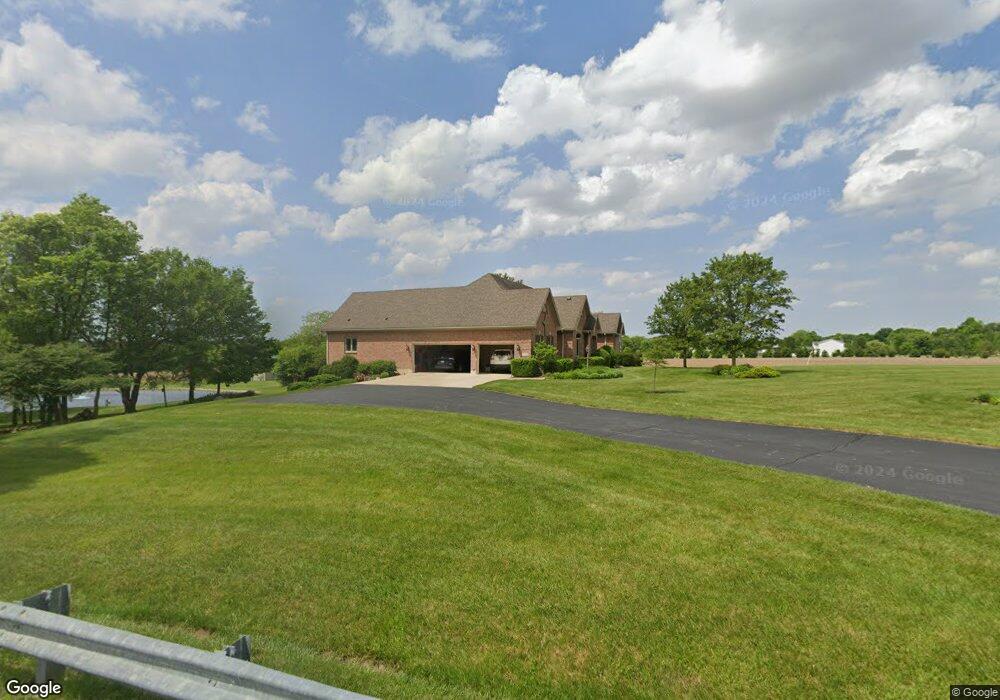
7110 Cox Rd Pleasant Hill, OH 45359
Estimated Value: $266,000 - $674,876
4
Beds
3
Baths
1,919
Sq Ft
$260/Sq Ft
Est. Value
About This Home
This home is located at 7110 Cox Rd, Pleasant Hill, OH 45359 and is currently estimated at $499,719, approximately $260 per square foot. 7110 Cox Rd is a home located in Miami County with nearby schools including Newton Elementary School and Newton High School.
Ownership History
Date
Name
Owned For
Owner Type
Purchase Details
Closed on
Nov 14, 2023
Sold by
Phillip And Constance Watson Family Trus and Watson Phillip L
Bought by
Watson Phillip L and Watson Constance K
Current Estimated Value
Purchase Details
Closed on
May 31, 2012
Sold by
Suber John H
Bought by
Watson Philip L and Watson Constance K
Home Financials for this Owner
Home Financials are based on the most recent Mortgage that was taken out on this home.
Original Mortgage
$125,000
Interest Rate
3.9%
Mortgage Type
Purchase Money Mortgage
Purchase Details
Closed on
Jul 27, 2011
Sold by
Suber Sharon F
Bought by
Suber John
Purchase Details
Closed on
Aug 16, 2005
Sold by
Suber John H
Bought by
Suber John H and Suber Sharon F
Create a Home Valuation Report for This Property
The Home Valuation Report is an in-depth analysis detailing your home's value as well as a comparison with similar homes in the area
Home Values in the Area
Average Home Value in this Area
Purchase History
| Date | Buyer | Sale Price | Title Company |
|---|---|---|---|
| Watson Phillip L | -- | None Listed On Document | |
| Watson Philip L | $369,000 | Landmark | |
| Suber John | -- | -- | |
| Suber John | -- | -- | |
| Suber John H | -- | -- |
Source: Public Records
Mortgage History
| Date | Status | Borrower | Loan Amount |
|---|---|---|---|
| Previous Owner | Watson Philip L | $125,000 | |
| Previous Owner | Watson Philip L | $100,000 |
Source: Public Records
Tax History Compared to Growth
Tax History
| Year | Tax Paid | Tax Assessment Tax Assessment Total Assessment is a certain percentage of the fair market value that is determined by local assessors to be the total taxable value of land and additions on the property. | Land | Improvement |
|---|---|---|---|---|
| 2024 | $5,077 | $148,390 | $13,740 | $134,650 |
| 2023 | $5,077 | $148,390 | $13,740 | $134,650 |
| 2022 | $5,196 | $148,390 | $13,740 | $134,650 |
| 2021 | $4,575 | $123,810 | $11,600 | $112,210 |
| 2020 | $4,588 | $123,810 | $11,600 | $112,210 |
| 2019 | $4,290 | $123,810 | $11,600 | $112,210 |
| 2018 | $3,611 | $105,570 | $13,730 | $91,840 |
| 2017 | $3,643 | $105,570 | $13,730 | $91,840 |
| 2016 | $3,600 | $105,570 | $13,730 | $91,840 |
| 2015 | $3,765 | $100,910 | $12,600 | $88,310 |
| 2014 | $3,765 | $100,910 | $12,600 | $88,310 |
| 2013 | $3,803 | $100,910 | $12,600 | $88,310 |
Source: Public Records
Map
Nearby Homes
- 309 W Franklin St
- 6200 State Route 718
- 1 N Main St
- 5845 Fenner Rd
- State Route 48
- 2211 S State Route 48
- 5940 Horseshoe Bend Rd
- 5920 Horseshoe Bend Rd
- 115 Vine St
- 9980 Ohio 718
- 3155 S State Route 48
- 4063 W State Route 55
- 3262 Heatherstone Dr
- 1144 Red Maple Dr
- 3860 Horseshoe Bend Rd
- G12-072300 S Kessler Frederick Rd
- 3318 Heatherstone Dr
- 2791 Meadowpoint Dr
- 2968 Hoying Dr
- 2960 Hoying Dr