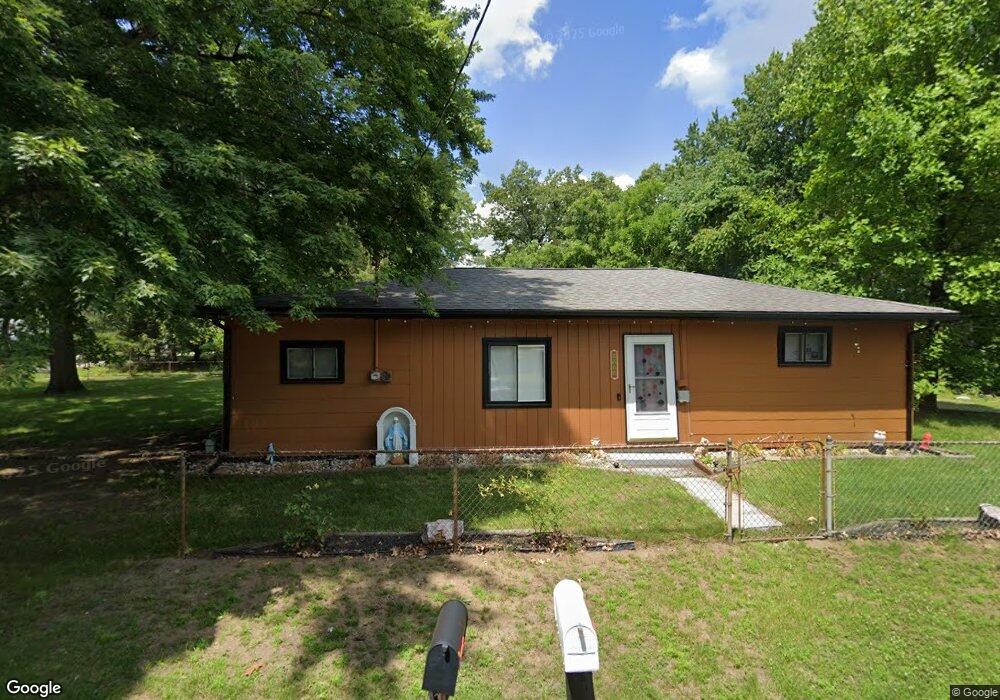
7110 Hancock St Holland, OH 43528
Estimated Value: $153,000 - $216,000
2
Beds
1
Bath
1,042
Sq Ft
$175/Sq Ft
Est. Value
About This Home
This home is located at 7110 Hancock St, Holland, OH 43528 and is currently estimated at $181,895, approximately $174 per square foot. 7110 Hancock St is a home located in Lucas County with nearby schools including Dorr Street Elementary School, Springfield Middle School, and Springfield High School.
Ownership History
Date
Name
Owned For
Owner Type
Purchase Details
Closed on
Aug 14, 2025
Sold by
Beck Sharon L and Beck David A
Bought by
Monroe Krystal M
Current Estimated Value
Home Financials for this Owner
Home Financials are based on the most recent Mortgage that was taken out on this home.
Original Mortgage
$49,600
Outstanding Balance
$49,557
Interest Rate
6.72%
Mortgage Type
New Conventional
Estimated Equity
$132,338
Purchase Details
Closed on
Jan 17, 1991
Sold by
Bell Chester J #
Purchase Details
Closed on
Jun 4, 1990
Sold by
Bell C V and C V
Create a Home Valuation Report for This Property
The Home Valuation Report is an in-depth analysis detailing your home's value as well as a comparison with similar homes in the area
Home Values in the Area
Average Home Value in this Area
Purchase History
| Date | Buyer | Sale Price | Title Company |
|---|---|---|---|
| Monroe Krystal M | $62,000 | None Listed On Document | |
| -- | -- | -- | |
| -- | -- | -- |
Source: Public Records
Mortgage History
| Date | Status | Borrower | Loan Amount |
|---|---|---|---|
| Open | Monroe Krystal M | $49,600 |
Source: Public Records
Tax History Compared to Growth
Tax History
| Year | Tax Paid | Tax Assessment Tax Assessment Total Assessment is a certain percentage of the fair market value that is determined by local assessors to be the total taxable value of land and additions on the property. | Land | Improvement |
|---|---|---|---|---|
| 2024 | $3,220 | $49,385 | $14,385 | $35,000 |
| 2023 | $2,476 | $34,685 | $11,935 | $22,750 |
| 2022 | $2,472 | $34,685 | $11,935 | $22,750 |
| 2021 | $2,328 | $34,685 | $11,935 | $22,750 |
| 2020 | $2,187 | $29,505 | $8,190 | $21,315 |
| 2019 | $2,138 | $29,505 | $8,190 | $21,315 |
| 2018 | $2,180 | $29,505 | $8,190 | $21,315 |
| 2017 | $2,237 | $28,840 | $8,015 | $20,825 |
| 2016 | $2,258 | $82,400 | $22,900 | $59,500 |
| 2015 | $2,254 | $82,400 | $22,900 | $59,500 |
| 2014 | $1,997 | $27,720 | $7,700 | $20,020 |
| 2013 | $1,997 | $27,720 | $7,700 | $20,020 |
Source: Public Records
Map
Nearby Homes
- 226 Perrine St
- 7238 Lilac Ct
- 7111 Nebraska Ave
- 134 Deerfield Dr
- 217 Pebble Beach Dr
- 617 & 621 S Mccord Rd
- 127 N Dorcas Rd
- 6855 Wharton Rd
- 319 S Mccord Rd
- 6607 Hill Ave
- 343 S Mccord Rd
- 508 Crystal Lake Dr
- 6955 Dorr St
- 324 Harefoote St
- 1053 Plum Grove Ln
- 352 Cheswick St
- 7331 Witherby Ct
- 426 Cheswick Rd
- 6339 Hill Ave
- 6324 Bapst Ave