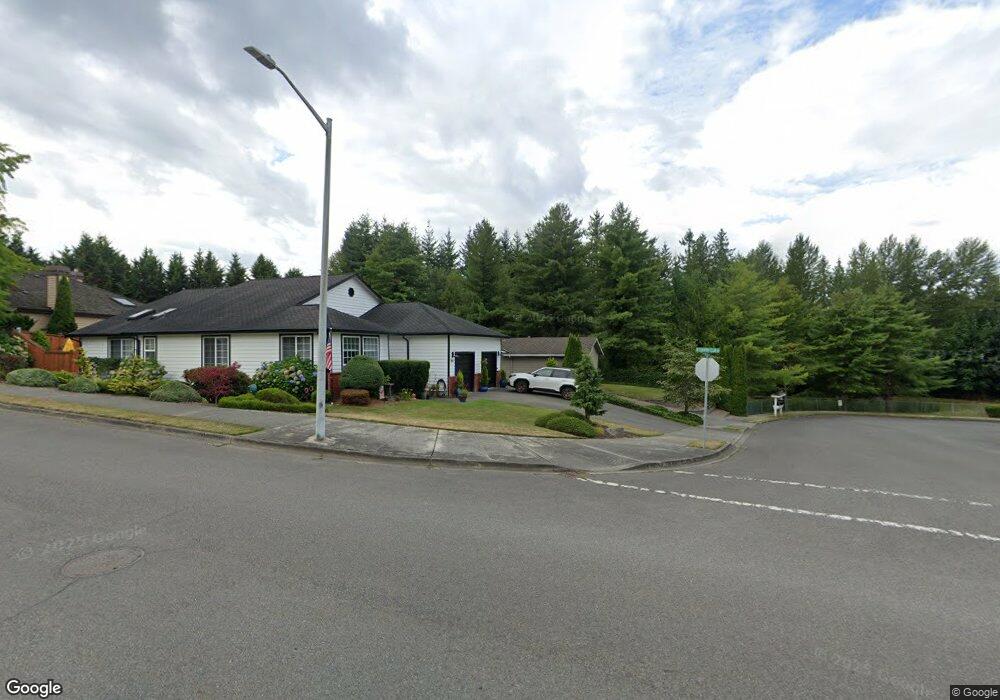
7110 Troon Ct Arlington, WA 98223
Estimated Value: $597,101 - $647,000
3
Beds
2
Baths
1,472
Sq Ft
$427/Sq Ft
Est. Value
About This Home
This home is located at 7110 Troon Ct, Arlington, WA 98223 and is currently estimated at $628,525, approximately $426 per square foot. 7110 Troon Ct is a home located in Snohomish County with nearby schools including Pioneer Elementary School, Haller Middle School, and Arlington High School.
Ownership History
Date
Name
Owned For
Owner Type
Purchase Details
Closed on
Sep 19, 2012
Sold by
Hughs Thomas Bradley
Bought by
Hughs Michelle Lynn
Current Estimated Value
Purchase Details
Closed on
Dec 27, 1995
Sold by
Markezines Enterprises Inc
Bought by
Hughs Thomas B and Hughs Michelle L
Home Financials for this Owner
Home Financials are based on the most recent Mortgage that was taken out on this home.
Original Mortgage
$135,788
Outstanding Balance
$3,693
Interest Rate
7.37%
Mortgage Type
FHA
Estimated Equity
$624,832
Purchase Details
Closed on
Sep 22, 1995
Sold by
Arlington Country Club Inc
Bought by
Markenzinis Enterprises Inc and Lexon Homes/Construction
Home Financials for this Owner
Home Financials are based on the most recent Mortgage that was taken out on this home.
Original Mortgage
$110,000
Interest Rate
7.97%
Mortgage Type
Construction
Create a Home Valuation Report for This Property
The Home Valuation Report is an in-depth analysis detailing your home's value as well as a comparison with similar homes in the area
Home Values in the Area
Average Home Value in this Area
Purchase History
| Date | Buyer | Sale Price | Title Company |
|---|---|---|---|
| Hughs Michelle Lynn | -- | None Available | |
| Hughs Thomas B | $137,500 | Commonwealth Land Title | |
| Markenzinis Enterprises Inc | $47,500 | Commonwealth Land Title Ins |
Source: Public Records
Mortgage History
| Date | Status | Borrower | Loan Amount |
|---|---|---|---|
| Open | Hughs Thomas B | $135,788 | |
| Previous Owner | Markenzinis Enterprises Inc | $110,000 |
Source: Public Records
Tax History Compared to Growth
Tax History
| Year | Tax Paid | Tax Assessment Tax Assessment Total Assessment is a certain percentage of the fair market value that is determined by local assessors to be the total taxable value of land and additions on the property. | Land | Improvement |
|---|---|---|---|---|
| 2025 | $4,150 | $522,700 | $262,000 | $260,700 |
| 2024 | $4,150 | $482,700 | $225,000 | $257,700 |
| 2023 | $3,873 | $500,700 | $234,000 | $266,700 |
| 2022 | $3,757 | $402,100 | $189,000 | $213,100 |
| 2020 | $3,012 | $332,700 | $145,000 | $187,700 |
| 2019 | $3,010 | $324,100 | $130,000 | $194,100 |
| 2018 | $3,461 | $295,900 | $113,000 | $182,900 |
| 2017 | $2,967 | $258,900 | $96,000 | $162,900 |
| 2016 | $2,962 | $242,500 | $86,000 | $156,500 |
| 2015 | $2,887 | $227,800 | $78,000 | $149,800 |
| 2013 | $2,086 | $162,800 | $61,000 | $101,800 |
Source: Public Records
Map
Nearby Homes
- 7305 W Country Club Dr
- 17712 W Country Club Dr
- 7421 W Country Club Dr
- 17721 Upland Dr
- 7524 Greenloft Ave NE
- 17418 Redhawk Dr
- 7422 Eaglefield Dr
- 18329 Cedarbough Loop
- 17322 80th Dr NE
- 6822 168th St NE
- 17614 82nd Dr NE
- 8209 Hunter Place
- 7023 Falcon Ct
- 17615 84th Ave NE
- 18214 Champions Dr
- 188 XX 71st Dr NE
- 18305 Champions Dr
- 6206 188th St NE Unit 59
- 6206 188th St NE Unit 63
- 18417 86th Dr NE
- 7116 Troon Ct
- 7210 W Country Club Dr
- 7216 W Country Club Dr
- 7211 176th Place NE
- 17624 W Country Club Dr
- 7113 Troon Ct
- 7213 W Country Club Dr
- 7215 176th Place NE
- 17621 W Country Club Dr
- 7222 W Country Club Dr
- 17514 72nd Dr NE
- 7219 W Country Club Dr
- 7101 Troon Ct
- 7107 Troon Ct
- 7219 176th Place NE
- 7103 172nd St NE
- 17627 W Country Club Dr
- 17700 W Country Club Dr
- 7225 W Country Club Dr
- 7228 W Country Club Dr