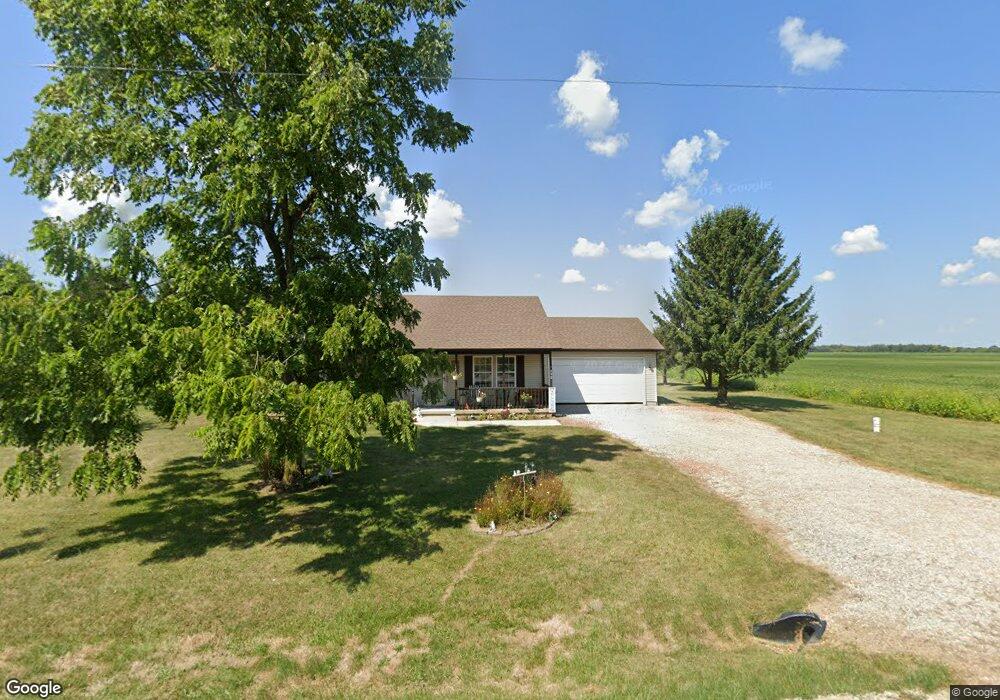
7110 van Wagener Rd London, OH 43140
Estimated Value: $361,000 - $396,000
3
Beds
2
Baths
1,763
Sq Ft
$210/Sq Ft
Est. Value
About This Home
This home is located at 7110 van Wagener Rd, London, OH 43140 and is currently estimated at $371,017, approximately $210 per square foot. 7110 van Wagener Rd is a home located in Madison County with nearby schools including Madison-Plains Elementary School, Madison-Plains Intermediate School, and Madison-Plains Junior High School.
Ownership History
Date
Name
Owned For
Owner Type
Purchase Details
Closed on
May 23, 2025
Sold by
Massey Carolyn R
Bought by
Carolyn R Massey Preservation Trust and Massey
Current Estimated Value
Purchase Details
Closed on
Sep 28, 2005
Sold by
Hawkins William G and Hawkins Marcy J
Bought by
Massey Jerry E and Massey Carolyn R
Home Financials for this Owner
Home Financials are based on the most recent Mortgage that was taken out on this home.
Original Mortgage
$150,000
Interest Rate
5.93%
Mortgage Type
Fannie Mae Freddie Mac
Purchase Details
Closed on
Jan 6, 1998
Sold by
Edwards Gregory A
Bought by
Hawkins William G
Home Financials for this Owner
Home Financials are based on the most recent Mortgage that was taken out on this home.
Original Mortgage
$72,000
Interest Rate
6.88%
Mortgage Type
New Conventional
Create a Home Valuation Report for This Property
The Home Valuation Report is an in-depth analysis detailing your home's value as well as a comparison with similar homes in the area
Home Values in the Area
Average Home Value in this Area
Purchase History
| Date | Buyer | Sale Price | Title Company |
|---|---|---|---|
| Carolyn R Massey Preservation Trust | -- | None Listed On Document | |
| Carolyn R Massey Preservation Trust | -- | None Listed On Document | |
| Massey Jerry E | $172,000 | Chicago Title | |
| Hawkins William G | $19,200 | -- |
Source: Public Records
Mortgage History
| Date | Status | Borrower | Loan Amount |
|---|---|---|---|
| Previous Owner | Massey Jerry E | $150,000 | |
| Previous Owner | Hawkins William G | $72,000 |
Source: Public Records
Tax History Compared to Growth
Tax History
| Year | Tax Paid | Tax Assessment Tax Assessment Total Assessment is a certain percentage of the fair market value that is determined by local assessors to be the total taxable value of land and additions on the property. | Land | Improvement |
|---|---|---|---|---|
| 2024 | $2,940 | $96,790 | $15,570 | $81,220 |
| 2023 | $2,940 | $96,790 | $15,570 | $81,220 |
| 2022 | $2,500 | $71,790 | $11,550 | $60,240 |
| 2021 | $2,306 | $71,790 | $11,550 | $60,240 |
| 2020 | $2,309 | $71,790 | $11,550 | $60,240 |
| 2019 | $2,052 | $66,640 | $12,600 | $54,040 |
| 2018 | $2,053 | $66,640 | $12,600 | $54,040 |
| 2017 | $1,623 | $66,640 | $12,600 | $54,040 |
| 2016 | $1,623 | $60,850 | $12,600 | $48,250 |
| 2015 | $1,622 | $60,850 | $12,600 | $48,250 |
| 2014 | $1,622 | $60,850 | $12,600 | $48,250 |
| 2013 | -- | $53,390 | $11,970 | $41,420 |
Source: Public Records
Map
Nearby Homes
- 0 Park Ln
- 3650 Wood Ln
- 4440 Deer Creek Ln
- 16018 Yankeetown-Chenoweth Rd
- 2880 State Route 665
- 233 Maddox Dr
- 620 Lois Ln
- 145 Old Xenia Rd SE
- 6970 Danville Rd
- 15 Stewart Ave
- 187 Mound St
- 44 South St
- 18 W Center St
- 186 W Center St
- 0 Olive St
- 103 Andrew Ct E
- 40 S Cherry St
- 154 E High St
- 144 E High St
- 661 Ohio 38
- 7164 van Wagener Rd
- 7159 van Wagener Rd
- 7115 van Wagener Rd
- 7085 van Wagener Rd
- 7015 van Wagener Rd
- 7295 van Wagener Rd
- 6961 van Wagener Rd
- 6881 van Wagener Rd
- 6825 van Wagener Rd
- 7499 van Wagener Rd
- 6801 van Wagener Rd
- 6990 State Route 56 SE
- 6750 State Route 56 SE
- 6755 van Wagener Rd
- 6650 State Route 56 SE
- 6745 van Wagener Rd
- 6780 State Route 56 SE
- 6830 State Route 56 SE
- 6900 State Route 56 SE
- 6910 State Route 56 SE