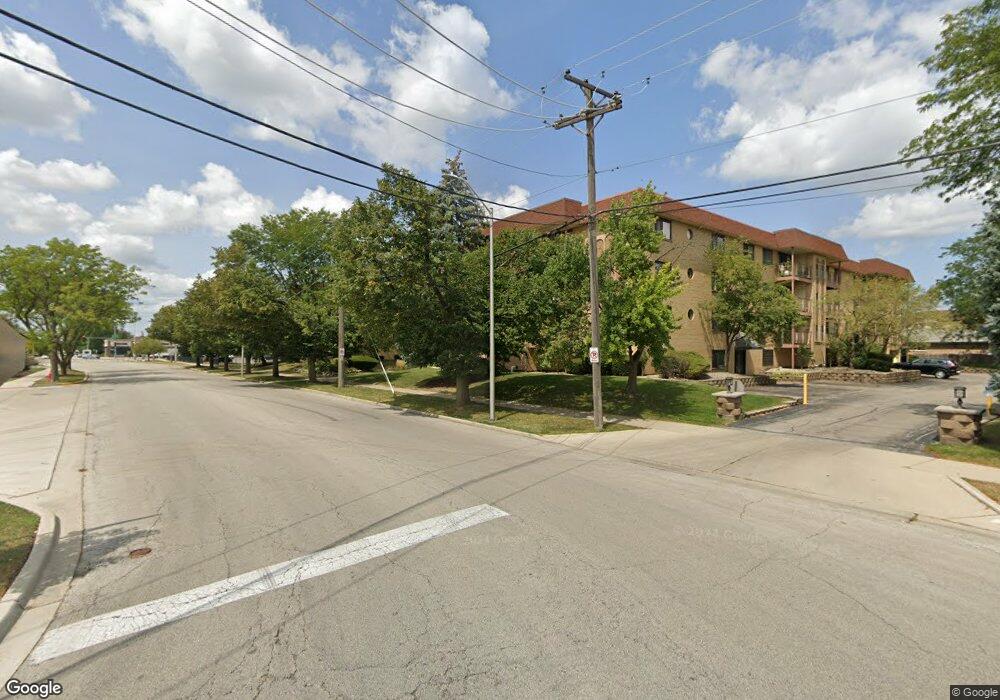
7110 W Cullom Ave Unit 208 Norridge, IL 60706
Estimated Value: $209,000 - $258,000
1
Bed
1
Bath
--
Sq Ft
1.64
Acres
About This Home
This home is located at 7110 W Cullom Ave Unit 208, Norridge, IL 60706 and is currently estimated at $232,750. 7110 W Cullom Ave Unit 208 is a home located in Cook County with nearby schools including Union Ridge Elementary School, Ridgewood Community High School, and St. Monica Academy.
Ownership History
Date
Name
Owned For
Owner Type
Purchase Details
Closed on
Mar 28, 2005
Sold by
Valegurschi Livia M and Stanescu Livia M
Bought by
Lasek Lidia
Current Estimated Value
Home Financials for this Owner
Home Financials are based on the most recent Mortgage that was taken out on this home.
Original Mortgage
$149,000
Outstanding Balance
$76,540
Interest Rate
5.71%
Mortgage Type
Unknown
Estimated Equity
$156,210
Purchase Details
Closed on
Jun 4, 1999
Sold by
Lasalle Bank National Assn
Bought by
Stanescu Livia M
Home Financials for this Owner
Home Financials are based on the most recent Mortgage that was taken out on this home.
Original Mortgage
$112,520
Interest Rate
7.61%
Purchase Details
Closed on
Sep 8, 1995
Sold by
Rossi Marie D
Bought by
Columbia National Bank Of Chicago
Purchase Details
Closed on
Jun 5, 1995
Sold by
Parkway Bank & Trust Company
Bought by
Rossi Marie D
Create a Home Valuation Report for This Property
The Home Valuation Report is an in-depth analysis detailing your home's value as well as a comparison with similar homes in the area
Home Values in the Area
Average Home Value in this Area
Purchase History
| Date | Buyer | Sale Price | Title Company |
|---|---|---|---|
| Lasek Lidia | $209,000 | Rtc | |
| Stanescu Livia M | $116,000 | -- | |
| Columbia National Bank Of Chicago | -- | -- | |
| Rossi Marie D | $105,000 | -- |
Source: Public Records
Mortgage History
| Date | Status | Borrower | Loan Amount |
|---|---|---|---|
| Open | Lasek Lidia | $149,000 | |
| Previous Owner | Stanescu Livia M | $112,520 |
Source: Public Records
Tax History Compared to Growth
Tax History
| Year | Tax Paid | Tax Assessment Tax Assessment Total Assessment is a certain percentage of the fair market value that is determined by local assessors to be the total taxable value of land and additions on the property. | Land | Improvement |
|---|---|---|---|---|
| 2024 | $3,143 | $15,768 | $1,209 | $14,559 |
| 2023 | $3,036 | $15,768 | $1,209 | $14,559 |
| 2022 | $3,036 | $15,768 | $1,209 | $14,559 |
| 2021 | $2,314 | $11,707 | $1,069 | $10,638 |
| 2020 | $2,303 | $11,707 | $1,069 | $10,638 |
| 2019 | $2,318 | $13,143 | $1,069 | $12,074 |
| 2018 | $1,817 | $10,018 | $883 | $9,135 |
| 2017 | $1,778 | $10,018 | $883 | $9,135 |
| 2016 | $1,903 | $10,018 | $883 | $9,135 |
| 2015 | $2,010 | $9,844 | $906 | $8,938 |
| 2014 | $2,004 | $9,844 | $906 | $8,938 |
| 2013 | $1,955 | $9,844 | $906 | $8,938 |
Source: Public Records
Map
Nearby Homes
- 6950 W Forest Preserve Dr Unit 207
- 6950 W Forest Preserve Dr Unit 202
- 6916 W Forest Preserve Dr
- 4339 N Newland Ave
- 6856 W Montrose Ave
- 4129 N Oketo Ave
- 3947 N Neva Ave
- 4016 N Odell Ave
- 3924 N Oconto Ave
- 4304 N Oriole Ave
- 4224 N Oriole Ave
- 3909 N New England Ave
- 4435 N Harlem Ave
- 4748 N Newland Ave
- 3925 N Olcott Ave
- 4220 N Ottawa Ave
- 7410 W Lawrence Ave Unit 115
- 4212 N Ottawa Ave
- 7431 W Forest Preserve Ave
- 4811 N Harlem Ave Unit 3
- 7110 W Cullom Ave Unit 104
- 7110 W Cullom Ave Unit 204
- 7110 W Cullom Ave Unit 101
- 7110 W Cullom Ave Unit 309
- 7110 W Cullom Ave Unit 105
- 7110 W Cullom Ave Unit 211
- 7110 W Cullom Ave Unit 111
- 7110 W Cullom Ave Unit 306
- 7110 W Cullom Ave Unit 106
- 7110 W Cullom Ave Unit 303
- 7110 W Cullom Ave Unit 305
- 7110 W Cullom Ave Unit 107
- 7110 W Cullom Ave Unit 109
- 7110 W Cullom Ave Unit 209
- 7110 W Cullom Ave Unit 110
- 7110 W Cullom Ave Unit 302
- 7110 W Cullom Ave Unit 206
- 7110 W Cullom Ave Unit 203
- 7110 W Cullom Ave Unit 301
- 7110 W Cullom Ave Unit 304