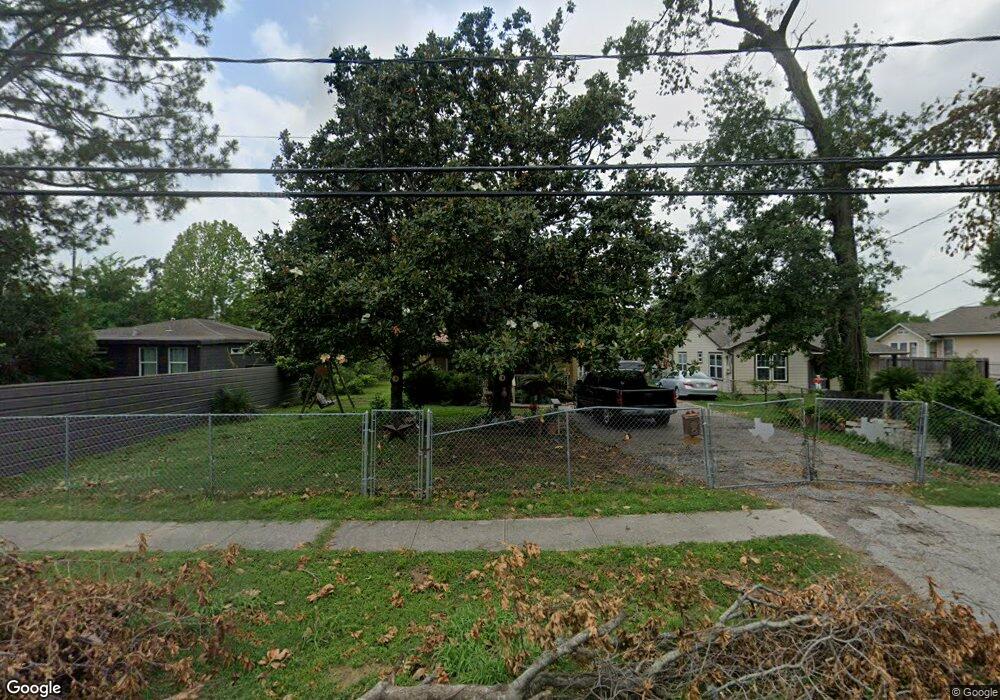
7111 Appleton St Houston, TX 77022
Northside-Northline NeighborhoodEstimated Value: $185,000 - $221,000
2
Beds
1
Bath
936
Sq Ft
$218/Sq Ft
Est. Value
About This Home
This home is located at 7111 Appleton St, Houston, TX 77022 and is currently estimated at $204,113, approximately $218 per square foot. 7111 Appleton St is a home located in Harris County with nearby schools including Herrera Elementary School, Burbank Middle School, and Sam Houston Math, Science & Technology Center.
Ownership History
Date
Name
Owned For
Owner Type
Purchase Details
Closed on
May 11, 1999
Sold by
Cashmere Mary Ruth and Cashmere Wilson Eugene
Bought by
Victor Eladio and Victor Patricia
Current Estimated Value
Home Financials for this Owner
Home Financials are based on the most recent Mortgage that was taken out on this home.
Original Mortgage
$49,400
Interest Rate
7.04%
Create a Home Valuation Report for This Property
The Home Valuation Report is an in-depth analysis detailing your home's value as well as a comparison with similar homes in the area
Home Values in the Area
Average Home Value in this Area
Purchase History
| Date | Buyer | Sale Price | Title Company |
|---|---|---|---|
| Victor Eladio | -- | Chicago Title |
Source: Public Records
Mortgage History
| Date | Status | Borrower | Loan Amount |
|---|---|---|---|
| Closed | Victor Eladio | $49,400 |
Source: Public Records
Tax History
| Year | Tax Paid | Tax Assessment Tax Assessment Total Assessment is a certain percentage of the fair market value that is determined by local assessors to be the total taxable value of land and additions on the property. | Land | Improvement |
|---|---|---|---|---|
| 2025 | $1,949 | $215,254 | $125,800 | $89,454 |
| 2024 | $1,949 | $207,871 | $125,800 | $82,071 |
| 2023 | $1,949 | $205,984 | $109,150 | $96,834 |
| 2022 | $3,057 | $165,171 | $81,400 | $83,771 |
| 2021 | $2,942 | $147,601 | $81,400 | $66,201 |
| 2020 | $2,779 | $139,366 | $81,400 | $57,966 |
| 2019 | $2,640 | $124,566 | $66,600 | $57,966 |
| 2018 | $1,628 | $94,841 | $46,250 | $48,591 |
| 2017 | $2,398 | $94,841 | $46,250 | $48,591 |
| 2016 | $2,398 | $94,841 | $46,250 | $48,591 |
| 2015 | $1,471 | $89,654 | $37,000 | $52,654 |
| 2014 | $1,471 | $79,982 | $25,900 | $54,082 |
Source: Public Records
Map
Nearby Homes
- 7009 Roswell St
- 7115 Roswell St
- 7206 Helmers St Unit A
- 7125 Farnsworth St
- 311 & 309 Bennington St
- 605 Post St
- 604 Yorkshire St
- 403 Frisco St
- 164 Wallace St
- 428 Van Molan St
- 402 Frisco St
- 809 Dorchester St
- 7523 Roswell St
- 720 Caperton St
- 319 Melbourne St
- 6515 Lloyd St
- 118 Van Molan St
- 7714 Helmers St
- 22 Stokes St
- 514 Melbourne St Unit A
- 425 Plymouth St
- 7115 Appleton St
- 7115 Appleton St
- 336 Plymouth St
- 7117 Appleton St
- 502 Westford St
- 504 Westford St
- 417 Plymouth St
- 7123 Appleton St
- 503 Westford St
- 519 Plymouth St
- 514 Westford St
- 7104 Appleton St
- 413 Plymouth St
- 523 Plymouth St
- 418 Plymouth St
- 522 Westford St
- 407 Plymouth St
- 527 Plymouth St
- 410 Plymouth St
Your Personal Tour Guide
Ask me questions while you tour the home.