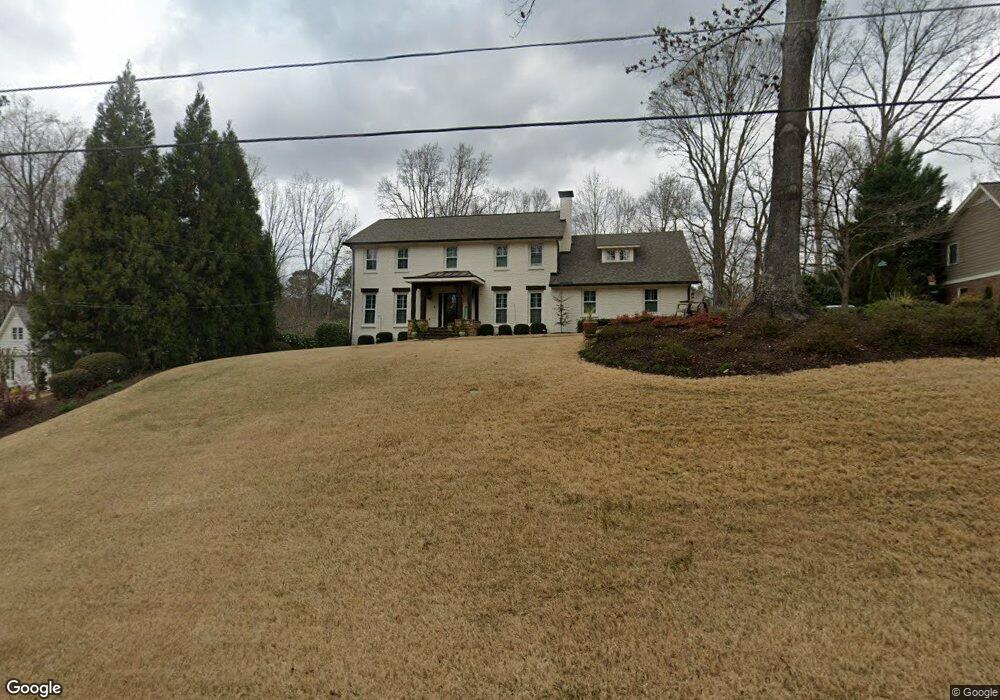
7111 Hunters Branch Ct NE Unit 2 Atlanta, GA 30328
The Branches NeighborhoodEstimated Value: $841,000 - $1,254,000
4
Beds
4
Baths
3,733
Sq Ft
$277/Sq Ft
Est. Value
About This Home
This home is located at 7111 Hunters Branch Ct NE Unit 2, Atlanta, GA 30328 and is currently estimated at $1,032,672, approximately $276 per square foot. 7111 Hunters Branch Ct NE Unit 2 is a home located in Fulton County with nearby schools including Woodland Elementary School, Sandy Springs Middle School, and North Springs High School.
Ownership History
Date
Name
Owned For
Owner Type
Purchase Details
Closed on
Feb 3, 2017
Sold by
Zgutowicz Lauren
Bought by
Zgutowicz Lauren and Zgutowicz Andrew
Current Estimated Value
Home Financials for this Owner
Home Financials are based on the most recent Mortgage that was taken out on this home.
Original Mortgage
$417,000
Outstanding Balance
$210,705
Interest Rate
4.2%
Mortgage Type
New Conventional
Estimated Equity
$821,967
Purchase Details
Closed on
Feb 25, 2009
Sold by
Oshnock Lauren
Bought by
Oshnock Lauren and Zgutowicz Andrew
Purchase Details
Closed on
Jan 25, 2008
Sold by
Humphrey Chad and Humphrey Lauren
Bought by
Humphrey Lauren
Purchase Details
Closed on
Aug 23, 2006
Sold by
Avery William H and Avery Irene G
Bought by
Humphrey Chad and Humphrey Lauren
Home Financials for this Owner
Home Financials are based on the most recent Mortgage that was taken out on this home.
Original Mortgage
$367,500
Interest Rate
6.67%
Mortgage Type
Trade
Create a Home Valuation Report for This Property
The Home Valuation Report is an in-depth analysis detailing your home's value as well as a comparison with similar homes in the area
Home Values in the Area
Average Home Value in this Area
Purchase History
| Date | Buyer | Sale Price | Title Company |
|---|---|---|---|
| Zgutowicz Lauren | -- | -- | |
| Oshnock Lauren | -- | -- | |
| Humphrey Lauren | -- | -- | |
| Humphrey Chad | $367,500 | -- |
Source: Public Records
Mortgage History
| Date | Status | Borrower | Loan Amount |
|---|---|---|---|
| Open | Zgutowicz Lauren | $417,000 | |
| Previous Owner | Humphrey Chad | $367,500 |
Source: Public Records
Tax History Compared to Growth
Tax History
| Year | Tax Paid | Tax Assessment Tax Assessment Total Assessment is a certain percentage of the fair market value that is determined by local assessors to be the total taxable value of land and additions on the property. | Land | Improvement |
|---|---|---|---|---|
| 2025 | $8,809 | $382,480 | $106,480 | $276,000 |
| 2023 | $8,390 | $297,240 | $95,000 | $202,240 |
| 2022 | $8,663 | $279,080 | $72,480 | $206,600 |
| 2021 | $8,159 | $256,080 | $52,720 | $203,360 |
| 2020 | $7,218 | $221,920 | $44,680 | $177,240 |
| 2019 | $7,117 | $218,000 | $43,880 | $174,120 |
| 2018 | $7,016 | $212,880 | $42,840 | $170,040 |
| 2017 | $4,436 | $130,840 | $35,040 | $95,800 |
| 2016 | $4,437 | $130,840 | $35,040 | $95,800 |
| 2015 | $4,453 | $130,840 | $35,040 | $95,800 |
| 2014 | $4,630 | $130,840 | $35,040 | $95,800 |
Source: Public Records
Map
Nearby Homes
- 37 Westfair Ct
- 7330 Hunters Branch Dr NE
- 7445 Talbot Colony NE
- 53 Winslow St
- 7040 Northgreen Dr NE Unit 7
- 5051 Pine Bark Cir
- 1172 Redfield Ridge
- 232 Peachtree Hollow Ct NE
- 915 Dumaine Trace
- 212 Abingdon Way NE
- 7900 Highland Bluff
- 5379 Harris Cir
- 911 Hollyfax Cir NE
- 5092 Hidden Branches Cir
- 5816 Chamblee Dunwoody Rd
- 1049 Trailridge Place
- 7580 Glisten Ave NE
- 725 Dalrymple Rd NE Unit 3H
- 5302 Fairfield N
- 1912 Huntingdon Chase
- 7131 Hunters Branch Ct NE Unit 2
- 7101 Hunters Branch Ct NE
- 7160 Hunters Branch Dr NE
- 7141 Hunters Branch Ct Unit 2
- 7110 Hunters Branch Ct NE
- 7170 Hunters Branch Dr NE
- 7080 Hunters Branch Ct NE
- 7140 Hunters Branch Dr NE
- 7130 Hunters Branch Ct NE Unit 2
- 7105 Hunters Branch Dr NE
- 7180 Hunters Branch Dr
- 7125 Hunters Branch Dr NE Unit 2
- 500 Hunters Crossing Dr NE
- 480 Hunters Crossing Dr NE
- 430 Margate Dr NE
- 7185 Hunters Branch Dr NE
- 7185 Hunters
- 470 Hunters Crossing Dr NE
- 7075 Hunters Branch Dr NE