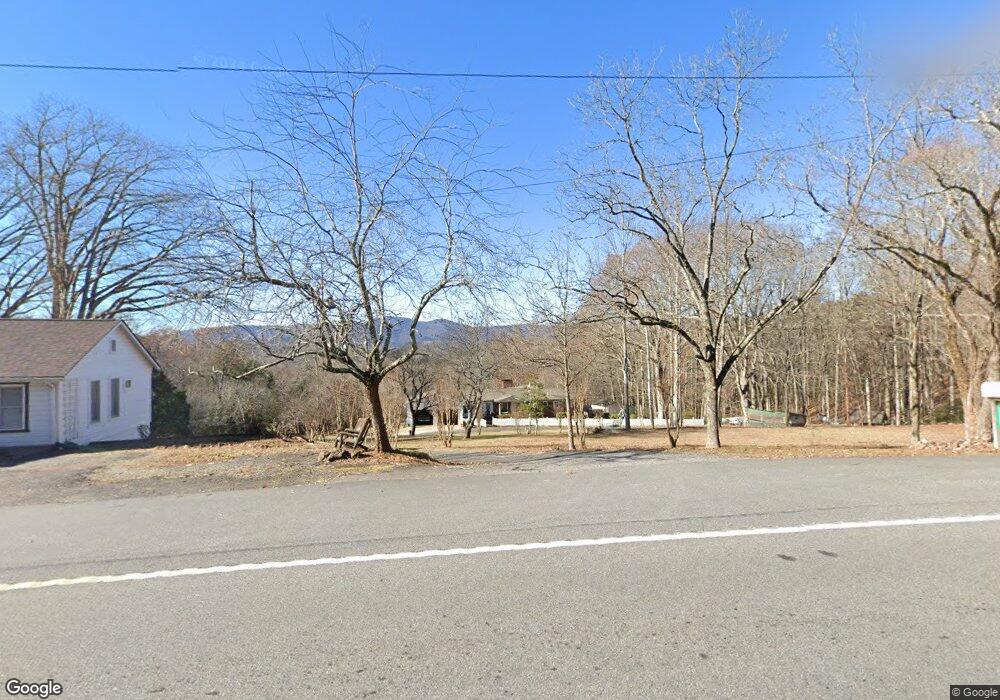
7111 U S Highway 19 Dahlonega, GA 30533
Estimated Value: $286,000 - $372,454
3
Beds
2
Baths
2,200
Sq Ft
$149/Sq Ft
Est. Value
About This Home
This home is located at 7111 U S Highway 19, Dahlonega, GA 30533 and is currently estimated at $327,114, approximately $148 per square foot. 7111 U S Highway 19 is a home located in Lumpkin County with nearby schools including Clay County Middle School and Lumpkin County High School.
Ownership History
Date
Name
Owned For
Owner Type
Purchase Details
Closed on
Nov 29, 2018
Sold by
Stout Jesse
Bought by
Allen Jermiah and Allen Michaela
Current Estimated Value
Purchase Details
Closed on
Feb 27, 2014
Sold by
Deutsche Bank National Tru
Bought by
Stout Jesse
Purchase Details
Closed on
Dec 3, 2013
Sold by
Emerson Aleta
Bought by
Deutsche Bank National Trust C
Purchase Details
Closed on
Apr 13, 2005
Sold by
Brown Rondall Alan
Bought by
Emerson Aleta
Home Financials for this Owner
Home Financials are based on the most recent Mortgage that was taken out on this home.
Original Mortgage
$240,000
Interest Rate
6.13%
Mortgage Type
New Conventional
Purchase Details
Closed on
Jun 26, 2002
Sold by
Ridley Charlie A
Bought by
Brown Rondall Alan
Purchase Details
Closed on
Dec 7, 1988
Sold by
Ridley Charlie A
Bought by
Ridley Charlie A
Purchase Details
Closed on
Apr 8, 1966
Bought by
Ridley Charlie A
Create a Home Valuation Report for This Property
The Home Valuation Report is an in-depth analysis detailing your home's value as well as a comparison with similar homes in the area
Home Values in the Area
Average Home Value in this Area
Purchase History
| Date | Buyer | Sale Price | Title Company |
|---|---|---|---|
| Allen Jermiah | $110,000 | -- | |
| Stout Jesse | $85,000 | -- | |
| Deutsche Bank National Trust C | $189,000 | -- | |
| Emerson Aleta | $300,000 | -- | |
| Brown Rondall Alan | $300,000 | -- | |
| Ridley Charlie A | -- | -- | |
| Ridley Charlie A | -- | -- |
Source: Public Records
Mortgage History
| Date | Status | Borrower | Loan Amount |
|---|---|---|---|
| Previous Owner | Emerson Aleta | $240,000 |
Source: Public Records
Tax History Compared to Growth
Tax History
| Year | Tax Paid | Tax Assessment Tax Assessment Total Assessment is a certain percentage of the fair market value that is determined by local assessors to be the total taxable value of land and additions on the property. | Land | Improvement |
|---|---|---|---|---|
| 2024 | $2,242 | $73,424 | $12,592 | $60,832 |
| 2023 | $1,619 | $68,833 | $11,769 | $57,064 |
| 2022 | $1,674 | $67,607 | $9,805 | $57,802 |
| 2021 | $1,497 | $58,490 | $9,805 | $48,685 |
| 2020 | $1,499 | $56,842 | $9,398 | $47,444 |
| 2019 | $1,171 | $56,842 | $9,398 | $47,444 |
| 2018 | $1,880 | $66,249 | $24,432 | $41,817 |
| 2017 | $1,959 | $67,714 | $24,432 | $43,282 |
| 2016 | $1,587 | $62,416 | $24,432 | $37,984 |
| 2015 | $2,432 | $91,426 | $24,432 | $66,994 |
| 2014 | $2,432 | $92,266 | $24,432 | $67,834 |
| 2013 | -- | $93,105 | $24,432 | $68,673 |
Source: Public Records
Map
Nearby Homes
- 0 Yahoola Rd Unit 10535206
- 0 Yahoola Rd Unit 7590460
- 7709 Highway 19 N
- 0 Yahoola Ridge Unit 10624699
- 0 Yahoola Ridge Unit 7665701
- 200 Huntington Place
- 46 Deer Acres Dr
- 105 Ranch Mountain Ct
- 00 Woodland Ln
- 399 Ranch Mountain Dr
- 434 Emerald Ridge
- 26 Rustin Ridge
- 24 Rustin Ridge
- 18 Rustin Ridge
- 0 Ridley Rd Unit 7672007
- 0 Ridley Rd Unit 10632021
- 1556 Syrup Mill Rd
- 13 Hallmark Place
- 1036 Wards Creek Dr
- 265 Hound Dog Ln
- 7111 Highway 19 N
- 7101 Highway 19 N
- 7089 N Hwy 19 N
- 7140 Highway 19 N
- 7121 Highway 19 N
- 238 Yahoola Rd
- 428 Alex Dr
- 7153 Highway 19 N
- 7153 Highway 19 N
- 201 Yahoola Rd
- 6970 Highway 19 N
- 7121 U S 19
- 0 Yahoola Rd Unit 8263706
- 0 Yahoola Rd Unit 5895638
- 0 Yahoola Rd
- 0 Yahoola Rd Unit 7436031
- 0 Yahoola Rd Unit 7191380
- 0 Yahoola Rd Unit 5512535
- 235 Yahoola Rd
- 58 Alex Place