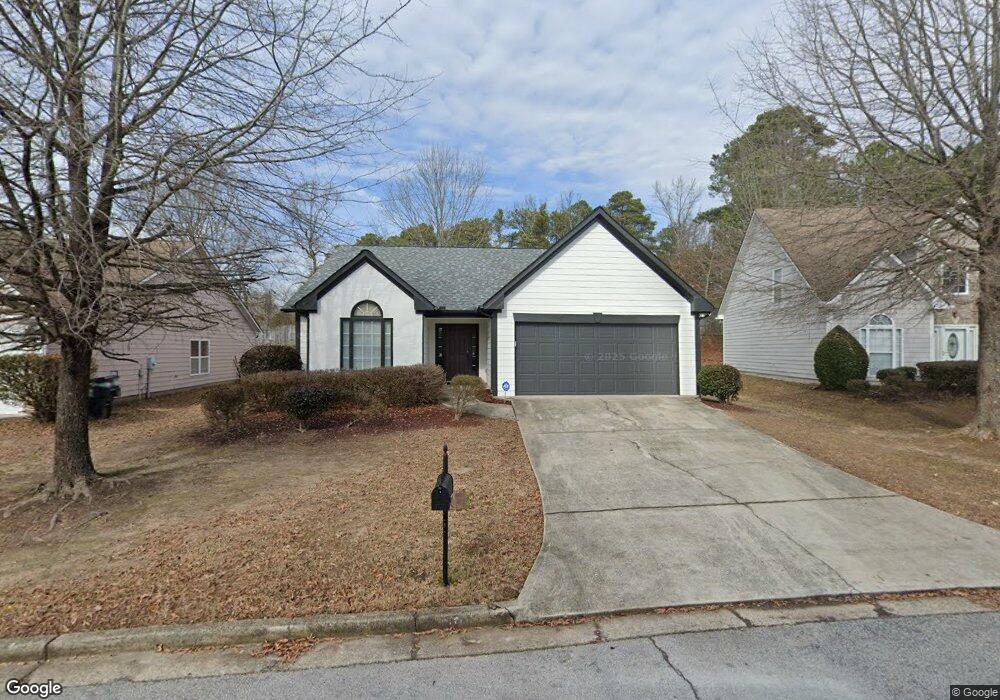
7112 Boulder Pass Union City, GA 30291
Estimated Value: $294,000 - $341,000
4
Beds
3
Baths
2,586
Sq Ft
$120/Sq Ft
Est. Value
About This Home
This home is located at 7112 Boulder Pass, Union City, GA 30291 and is currently estimated at $311,114, approximately $120 per square foot. 7112 Boulder Pass is a home located in Fulton County with nearby schools including Oakley Elementary School, Bear Creek Middle School, and Creekside High School.
Ownership History
Date
Name
Owned For
Owner Type
Purchase Details
Closed on
Sep 16, 2011
Sold by
Federal National Mortgage Association
Bought by
James Scott L
Current Estimated Value
Home Financials for this Owner
Home Financials are based on the most recent Mortgage that was taken out on this home.
Original Mortgage
$71,920
Outstanding Balance
$49,203
Interest Rate
4.24%
Mortgage Type
New Conventional
Estimated Equity
$261,911
Purchase Details
Closed on
Dec 7, 2010
Sold by
Everbank
Bought by
Federal Natl Mtg Assn Fnma
Purchase Details
Closed on
May 30, 2003
Sold by
D R Horton Inc
Bought by
Mansfield Gerald
Home Financials for this Owner
Home Financials are based on the most recent Mortgage that was taken out on this home.
Original Mortgage
$166,467
Interest Rate
5.68%
Mortgage Type
New Conventional
Create a Home Valuation Report for This Property
The Home Valuation Report is an in-depth analysis detailing your home's value as well as a comparison with similar homes in the area
Home Values in the Area
Average Home Value in this Area
Purchase History
| Date | Buyer | Sale Price | Title Company |
|---|---|---|---|
| James Scott L | $89,900 | -- | |
| Federal Natl Mtg Assn Fnma | -- | -- | |
| Everbank | $136,003 | -- | |
| Mansfield Gerald | -- | -- | |
| Mansfield Gerald | $166,500 | -- |
Source: Public Records
Mortgage History
| Date | Status | Borrower | Loan Amount |
|---|---|---|---|
| Open | James Scott L | $71,920 | |
| Previous Owner | Mansfield Gerald | $166,467 |
Source: Public Records
Tax History Compared to Growth
Tax History
| Year | Tax Paid | Tax Assessment Tax Assessment Total Assessment is a certain percentage of the fair market value that is determined by local assessors to be the total taxable value of land and additions on the property. | Land | Improvement |
|---|---|---|---|---|
| 2025 | $4,932 | $123,320 | $21,880 | $101,440 |
| 2023 | $3,925 | $139,040 | $31,240 | $107,800 |
| 2022 | $3,240 | $82,640 | $13,080 | $69,560 |
| 2021 | $3,210 | $80,200 | $12,680 | $67,520 |
| 2020 | $3,109 | $76,400 | $11,000 | $65,400 |
| 2019 | $2,296 | $68,400 | $9,720 | $58,680 |
| 2018 | $2,657 | $66,760 | $9,480 | $57,280 |
| 2017 | $2,103 | $51,600 | $10,520 | $41,080 |
| 2016 | $2,103 | $51,600 | $10,520 | $41,080 |
| 2015 | $2,109 | $51,600 | $10,520 | $41,080 |
| 2014 | $1,931 | $52,680 | $10,000 | $42,680 |
Source: Public Records
Map
Nearby Homes
- 7114 Boulder Pass
- 7110 Boulder Pass
- 7108 Boulder Pass
- 7111 Boulder Pass
- 7113 Boulder Pass
- 7101 Boulder Pass
- 7117 Boulder Pass
- 7118 Boulder Pass
- 335 Limestone Place
- 7103 Boulder Pass
- 7119 Boulder Pass
- 7120 Boulder Pass
- 325 Limestone Place
- 7121 Boulder Pass
- 4103 Rockhill Ct Unit 178
- 4103 Rockhill Ct
- 4109 Rockhill Ct
- 350 Limestone Place
- 7122 Boulder Pass
- 315 Limestone Place