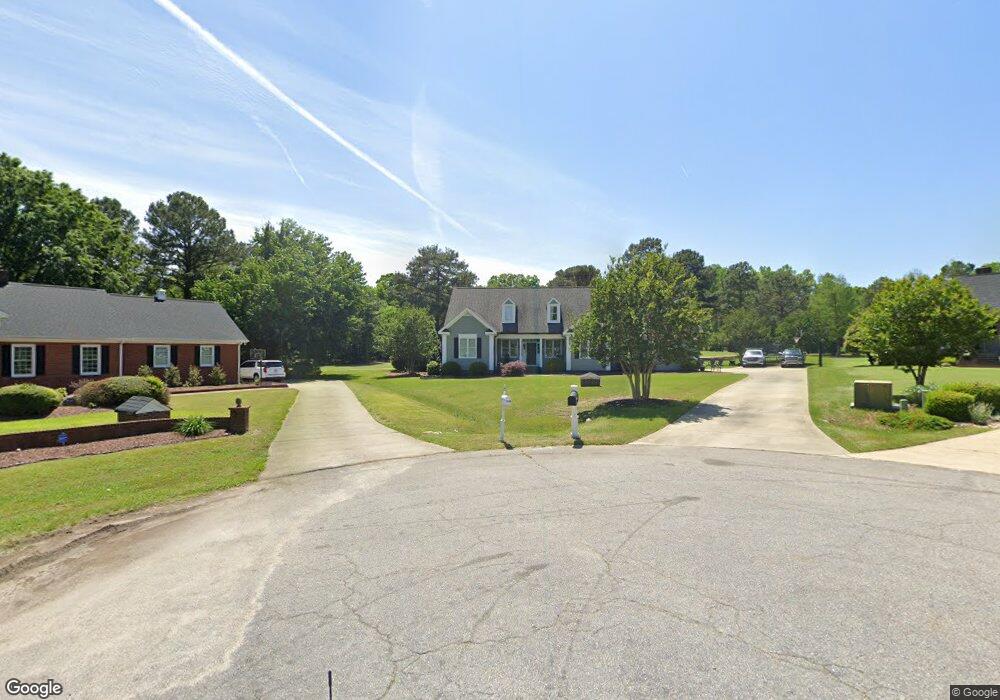
7112 Niblick Ct Fuquay Varina, NC 27526
Estimated Value: $789,000 - $819,000
3
Beds
3
Baths
3,577
Sq Ft
$225/Sq Ft
Est. Value
About This Home
This home is located at 7112 Niblick Ct, Fuquay Varina, NC 27526 and is currently estimated at $805,770, approximately $225 per square foot. 7112 Niblick Ct is a home located in Wake County with nearby schools including Southern Wake Academy and New School Montessori Center.
Ownership History
Date
Name
Owned For
Owner Type
Purchase Details
Closed on
Jan 16, 2015
Sold by
Meyer Kenneth D and Meyer Elizabeth B
Bought by
Smith Brian P and Smith Carol
Current Estimated Value
Home Financials for this Owner
Home Financials are based on the most recent Mortgage that was taken out on this home.
Original Mortgage
$273,600
Outstanding Balance
$210,643
Interest Rate
3.98%
Mortgage Type
New Conventional
Estimated Equity
$595,127
Purchase Details
Closed on
Jul 25, 2000
Sold by
Fearing Tatnal W and Fearing Iva H
Bought by
Meyer Kenneth D and Meyer Elizabeth B
Purchase Details
Closed on
Aug 30, 1999
Sold by
Gerald W Currin Builders Inc
Bought by
Fearing Tatnal W and Fearing Iva H
Purchase Details
Closed on
Mar 17, 1999
Sold by
Wsd Farms
Bought by
Gerald W Currin Builders Inc
Create a Home Valuation Report for This Property
The Home Valuation Report is an in-depth analysis detailing your home's value as well as a comparison with similar homes in the area
Home Values in the Area
Average Home Value in this Area
Purchase History
| Date | Buyer | Sale Price | Title Company |
|---|---|---|---|
| Smith Brian P | $288,000 | None Available | |
| Meyer Kenneth D | $325,000 | -- | |
| Fearing Tatnal W | $287,000 | -- | |
| Gerald W Currin Builders Inc | $56,000 | -- |
Source: Public Records
Mortgage History
| Date | Status | Borrower | Loan Amount |
|---|---|---|---|
| Open | Smith Brian P | $273,600 |
Source: Public Records
Tax History Compared to Growth
Tax History
| Year | Tax Paid | Tax Assessment Tax Assessment Total Assessment is a certain percentage of the fair market value that is determined by local assessors to be the total taxable value of land and additions on the property. | Land | Improvement |
|---|---|---|---|---|
| 2025 | $4,833 | $752,498 | $181,250 | $571,248 |
| 2024 | $4,693 | $752,498 | $181,250 | $571,248 |
| 2023 | $3,932 | $501,729 | $114,000 | $387,729 |
| 2022 | $3,643 | $501,729 | $114,000 | $387,729 |
| 2021 | $3,546 | $501,729 | $114,000 | $387,729 |
| 2020 | $3,487 | $501,729 | $114,000 | $387,729 |
| 2019 | $3,348 | $407,517 | $102,000 | $305,517 |
| 2018 | $3,078 | $407,517 | $102,000 | $305,517 |
| 2017 | $2,917 | $407,517 | $102,000 | $305,517 |
| 2016 | $2,858 | $407,517 | $102,000 | $305,517 |
| 2015 | $3,110 | $444,944 | $140,000 | $304,944 |
| 2014 | $2,948 | $444,944 | $140,000 | $304,944 |
Source: Public Records
Map
Nearby Homes
- 6617 Whitted Rd
- 6517 Whitted Rd
- 6553 Vintage Ridge Ln
- 6533 Vintage Ridge Ln
- 6521 Vintage Ridge Ln
- 5180 Copain Cove
- Atlas End Unit Plan at Atwater Station - Midtown Collection
- Cora End Unit Plan at Atwater Station - Midtown Collection
- Willow Plan at Atwater Station - Village Collection
- Atlas Interior Unit Plan at Atwater Station - Midtown Collection
- Cora Interior Unit Plan at Atwater Station - Midtown Collection
- Bella Plan at Atwater Station - Village Collection
- Pomona Interior unit Plan at Atwater Station - Midtown Collection
- Pomona End Unit Plan at Atwater Station - Midtown Collection
- Luna Interior Unit Plan at Atwater Station - Midtown Collection
- Sawyer 2 Plan at Atwater Station - Homestead Collection
- Grayson 2 Plan at Atwater Station - Homestead Collection
- Everly 2 Plan at Atwater Station - Homestead Collection
- Braxton 2 Plan at Atwater Station - Homestead Collection
- Timothy Plan at Atwater Station - Village Collection
- 7108 Niblick Ct
- 7109 Niblick Ct
- 7104 Niblick Ct
- 8409 Sarazen Place
- 7105 Niblick Ct
- 7100 Niblick Ct
- 8401 Sarazen Place
- 7101 Niblick Ct
- 8417 Sarazen Place
- 117 Progress Dr
- 6616 Whitted Rd
- 6628 Bentwinds Ln
- 6632 Bentwinds Ln
- 6612 Whitted Rd
- 6624 Whitted Rd
- 6626 Whitted Rd
- 6628 Whitted Rd
- 8408 Sarazen Place
- 8412 Sarazen Place
- 6632 Whitted Rd