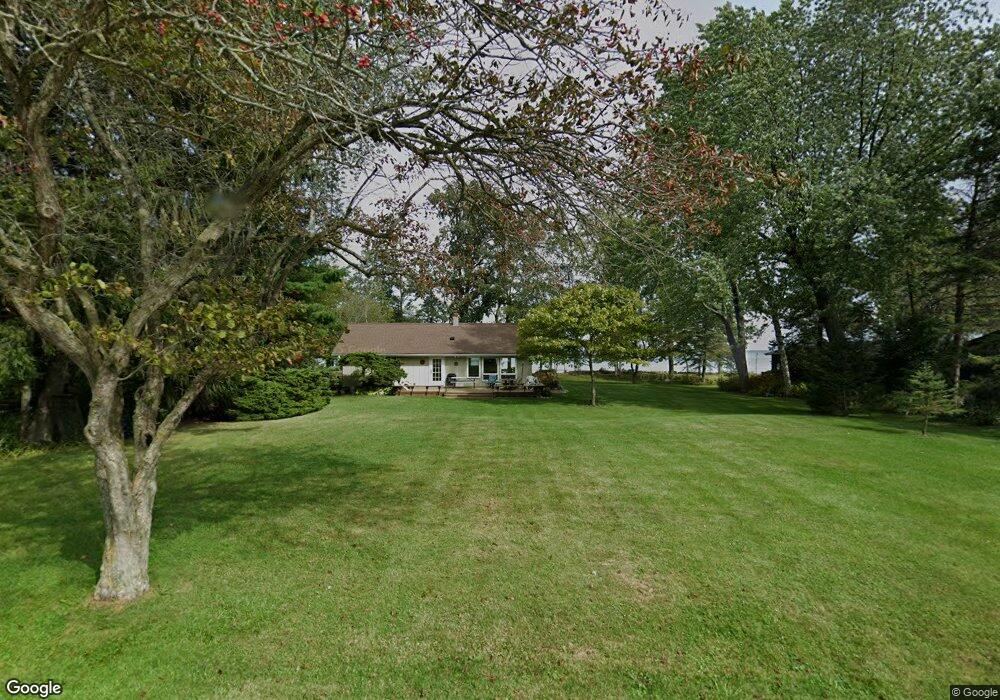
7112 Sauk Trail Beach Cedar Grove, WI 53013
Estimated Value: $691,000 - $1,391,000
--
Bed
--
Bath
--
Sq Ft
1.07
Acres
About This Home
This home is located at 7112 Sauk Trail Beach, Cedar Grove, WI 53013 and is currently estimated at $1,021,812. 7112 Sauk Trail Beach is a home with nearby schools including Cedar Grove-Belgium Elementary School, Cedar Grove-Belgium Middle School, and Cedar Grove-Belgium High School.
Ownership History
Date
Name
Owned For
Owner Type
Purchase Details
Closed on
Jun 30, 2017
Sold by
Knorre Joan M and Knorre Thomas
Bought by
Foley Cottage Llc
Current Estimated Value
Purchase Details
Closed on
Jun 29, 2017
Sold by
Braden Trust
Bought by
Foley Cottage Llc
Purchase Details
Closed on
Jun 28, 2017
Sold by
Latus Monica M and Latus Robert
Bought by
Foley Cottage Llc
Purchase Details
Closed on
Jun 26, 2017
Sold by
Cemig Jeremy R and Cemig Rositta A
Bought by
Foley Cottage Llc
Purchase Details
Closed on
Jun 1, 2016
Sold by
Braden Kevin and Braden Mary
Bought by
Braden Revocable Living Trust
Purchase Details
Closed on
Jan 2, 2014
Sold by
Foley Colleen M and Martinez Colleen F
Bought by
Gemig Jeremy R and Gemig Rositta M
Purchase Details
Closed on
Nov 5, 2013
Sold by
Foley Colleen M and Martinez Colleen F
Bought by
Gemig Jeremy R and Gemig Rositta M
Create a Home Valuation Report for This Property
The Home Valuation Report is an in-depth analysis detailing your home's value as well as a comparison with similar homes in the area
Home Values in the Area
Average Home Value in this Area
Purchase History
| Date | Buyer | Sale Price | Title Company |
|---|---|---|---|
| Foley Cottage Llc | -- | -- | |
| Foley Cottage Llc | -- | -- | |
| Foley Cottage Llc | -- | -- | |
| Foley Cottage Llc | -- | -- | |
| Foley Cottage Llc | -- | -- | |
| Foley Cottage Llc | -- | -- | |
| Foley Cottage Llc | -- | -- | |
| Braden Revocable Living Trust | -- | -- | |
| Gemig Jeremy R | $20,500 | None Available | |
| Gemig Jeremy R | $20,500 | None Available |
Source: Public Records
Tax History Compared to Growth
Tax History
| Year | Tax Paid | Tax Assessment Tax Assessment Total Assessment is a certain percentage of the fair market value that is determined by local assessors to be the total taxable value of land and additions on the property. | Land | Improvement |
|---|---|---|---|---|
| 2024 | $6,159 | $581,100 | $478,500 | $102,600 |
| 2023 | $5,860 | $581,100 | $478,500 | $102,600 |
| 2022 | $5,719 | $581,100 | $478,500 | $102,600 |
| 2021 | $5,817 | $581,100 | $478,500 | $102,600 |
| 2020 | $6,812 | $581,100 | $478,500 | $102,600 |
| 2019 | $6,821 | $581,100 | $478,500 | $102,600 |
| 2018 | $6,742 | $581,100 | $478,500 | $102,600 |
| 2017 | $6,594 | $581,100 | $478,500 | $102,600 |
| 2016 | $6,707 | $581,100 | $478,500 | $102,600 |
| 2015 | $6,538 | $581,100 | $478,500 | $102,600 |
| 2014 | $6,634 | $581,100 | $478,500 | $102,600 |
| 2013 | $6,923 | $581,100 | $478,500 | $102,600 |
Source: Public Records
Map
Nearby Homes
- 7064 Sauk Trail Beach Rd
- 7182 Sauk Trail Rd
- N645 Marine Dr
- 947 Berenschot Trail
- 631 E Cedar Ave
- Lt1 County Road Rr
- 116 Sunrise Ct
- 154 Water Ct
- 502 S Main St
- Lt88 Bruce Ct
- Lt90 Bruce Ct
- Lt86 Bruce Ct
- Lt85 Bruce Ct
- Lt89 Bruce Ct
- Lt87 Bruce Ct
- 115 S Main St
- Lt93 S 5th St
- Lt97 S 5th St
- Lt91 S 5th St
- Lt92 S 5th St
- 7122 Sauk Trail Beach Rd
- 7104 Sauk Trail Beach
- 7122 Sauk Trail Beach
- 7098 Sauk Trail Beach Rd
- 7132 Sauk Trail Beach
- 7090 Sauk Trail Beach
- 7140 Sauk Trail Beach Rd
- 7070 Sauk Trail Rd
- 7148 Sauk Trail Beach
- 7064 Sauk Trail Beach
- 7160 Sauk Trail Beach
- 7062 Sauk Trail Beach
- 7046 Sauk Trail Beach
- 7034 Sauk Trail Beach
- 175 Twin Valley Trail
- 227 Joans Ct
- 230 Joans Ct
- 236 Joans Ct
- 112 Hidden Bluff Rd
- 177 Twin Valley Trail