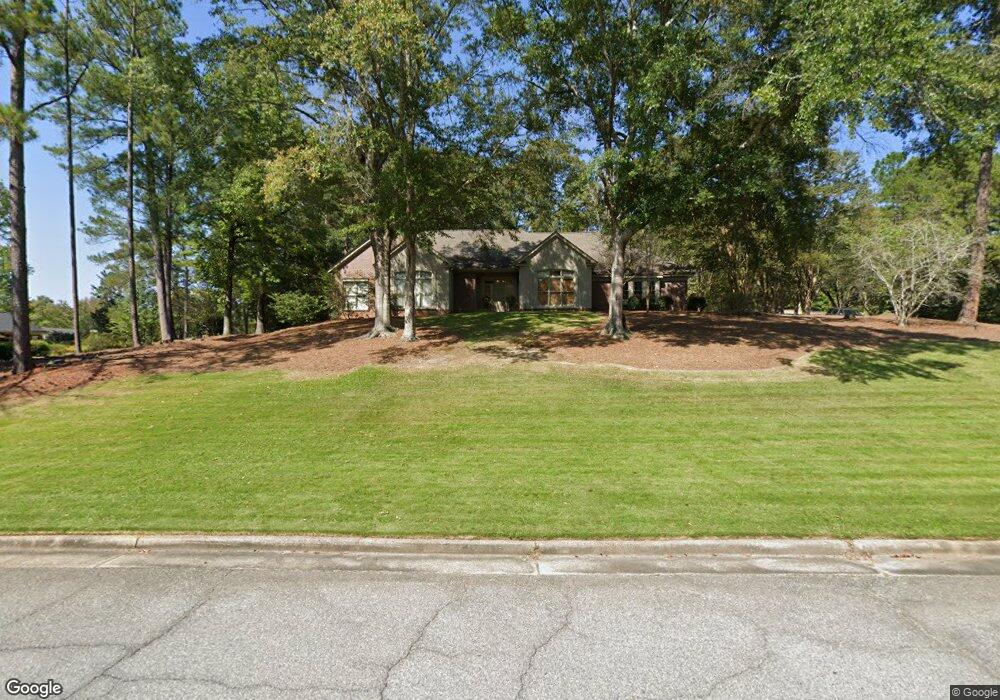
7112 Stillwater Dr Columbus, GA 31904
Northern Columbus NeighborhoodEstimated Value: $630,564 - $773,000
4
Beds
5
Baths
4,066
Sq Ft
$173/Sq Ft
Est. Value
About This Home
This home is located at 7112 Stillwater Dr, Columbus, GA 31904 and is currently estimated at $701,521, approximately $172 per square foot. 7112 Stillwater Dr is a home located in Muscogee County with nearby schools including River Road Elementary School, Double Churches Middle School, and Northside High School.
Ownership History
Date
Name
Owned For
Owner Type
Purchase Details
Closed on
May 5, 2021
Sold by
Pound Carroll K
Bought by
Pound William C
Current Estimated Value
Purchase Details
Closed on
Aug 2, 2012
Sold by
Pound William C
Bought by
Pound Carroll K
Purchase Details
Closed on
May 25, 2012
Sold by
Pound Carroll K
Bought by
Pound William C
Home Financials for this Owner
Home Financials are based on the most recent Mortgage that was taken out on this home.
Original Mortgage
$275,000
Interest Rate
3.88%
Mortgage Type
New Conventional
Create a Home Valuation Report for This Property
The Home Valuation Report is an in-depth analysis detailing your home's value as well as a comparison with similar homes in the area
Home Values in the Area
Average Home Value in this Area
Purchase History
| Date | Buyer | Sale Price | Title Company |
|---|---|---|---|
| Pound William C | -- | -- | |
| Pound Carroll K | -- | -- | |
| Pound William C | -- | -- |
Source: Public Records
Mortgage History
| Date | Status | Borrower | Loan Amount |
|---|---|---|---|
| Previous Owner | Pound William C | $275,000 |
Source: Public Records
Tax History Compared to Growth
Tax History
| Year | Tax Paid | Tax Assessment Tax Assessment Total Assessment is a certain percentage of the fair market value that is determined by local assessors to be the total taxable value of land and additions on the property. | Land | Improvement |
|---|---|---|---|---|
| 2025 | $5,263 | $240,548 | $33,976 | $206,572 |
| 2024 | $5,262 | $240,548 | $33,976 | $206,572 |
| 2023 | $4,601 | $240,548 | $33,976 | $206,572 |
| 2022 | $5,488 | $199,332 | $33,976 | $165,356 |
| 2021 | $5,481 | $172,536 | $33,976 | $138,560 |
| 2020 | $5,483 | $172,536 | $33,976 | $138,560 |
| 2019 | $5,502 | $172,536 | $33,976 | $138,560 |
| 2018 | $5,502 | $172,536 | $33,976 | $138,560 |
| 2017 | $5,521 | $172,536 | $33,976 | $138,560 |
| 2016 | $5,543 | $147,636 | $23,586 | $124,050 |
| 2015 | $2,220 | $147,636 | $23,586 | $124,050 |
| 2014 | $2,223 | $147,636 | $23,586 | $124,050 |
| 2013 | -- | $147,636 | $23,586 | $124,050 |
Source: Public Records
Map
Nearby Homes
- 7209 Lullwater Rd
- 7209 Williams Hill Rd
- 284 Zachary Ct
- 4 Mountain Ridge Ct
- 5 Mountain Ridge Ct
- 7172 Standing Boy Rd
- 6619 Woodberry Rd
- 6601 Standing Boy Rd
- 6528 Standing Boy Rd
- 7526 River Crest Dr
- 6500 Standing Boy Rd Unit 6
- 767 River Oaks Ct
- 6688 Creekview Place
- 7433 Rolling Bend Ct
- 7500 River Rd
- 152 & 206 Willett Dr
- 7600 Rolling Bend Rd
- 7301 Grand View Rd
- 7044 Spring Walk Dr
- 1065 Lee Road 315
- 7138 Stillwater Dr
- 7161 Williams Hill Rd
- 7162 Stillwater Dr
- 7100 Stillwater Dr
- 7113 Stillwater Dr
- 7173 Williams Hill Rd
- 7162 Williams Hill Rd
- 7174 Stillwater Dr
- 7125 Stillwater Dr
- 0 Williams Hill Rd
- 7101 Stillwater Dr
- 0 Stillwater Dr Unit 2905318
- 0 Stillwater Dr Unit 7510525
- 0 Stillwater Dr
- 7137 Stillwater Dr
- 7186 Stillwater Dr
- 7174 Williams Hill Rd
- 7149 Stillwater Dr
- 7185 Williams Hill Rd
- 7161 Stillwater Dr