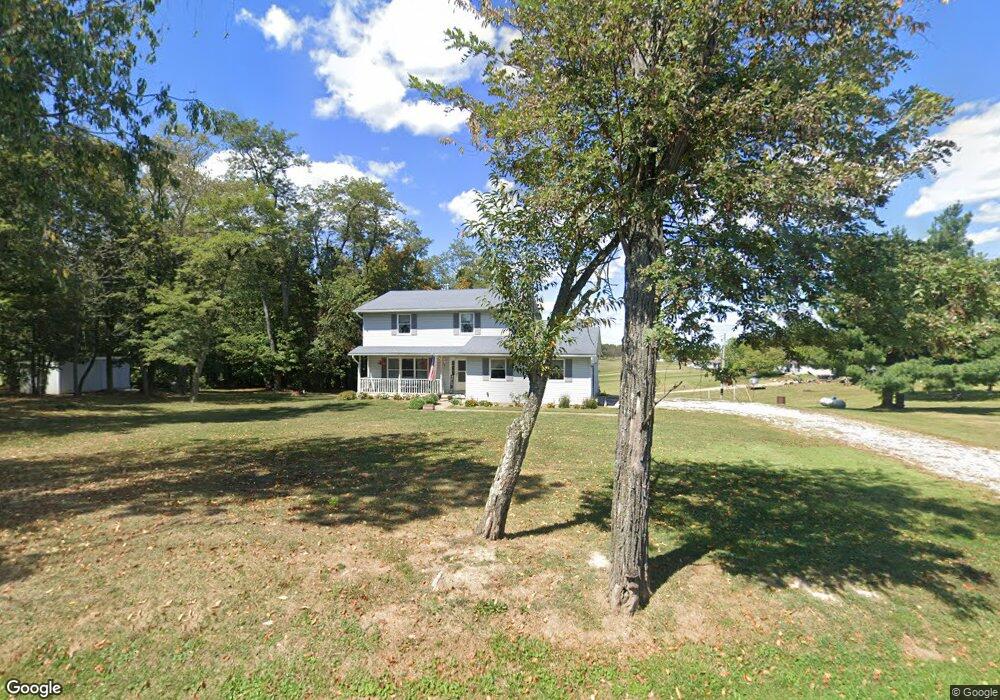
71120 Morristown Flushing Rd Flushing, OH 43977
Estimated Value: $156,000 - $277,850
3
Beds
2
Baths
1,863
Sq Ft
$122/Sq Ft
Est. Value
About This Home
This home is located at 71120 Morristown Flushing Rd, Flushing, OH 43977 and is currently estimated at $227,213, approximately $121 per square foot. 71120 Morristown Flushing Rd is a home located in Belmont County with nearby schools including Union Local Elementary School, Union Local Middle School, and Union Local High School.
Ownership History
Date
Name
Owned For
Owner Type
Purchase Details
Closed on
Apr 14, 1997
Sold by
Cope Edwin R and Cope Judy E
Bought by
Cope Edwin R and Cope Judy E
Current Estimated Value
Purchase Details
Closed on
Jan 1, 1986
Sold by
Bedway Toni and Bedway John
Bought by
Bedway Toni and Bedway John
Create a Home Valuation Report for This Property
The Home Valuation Report is an in-depth analysis detailing your home's value as well as a comparison with similar homes in the area
Home Values in the Area
Average Home Value in this Area
Purchase History
| Date | Buyer | Sale Price | Title Company |
|---|---|---|---|
| Cope Edwin R | $13,000 | -- | |
| Bedway Toni | -- | -- |
Source: Public Records
Tax History Compared to Growth
Tax History
| Year | Tax Paid | Tax Assessment Tax Assessment Total Assessment is a certain percentage of the fair market value that is determined by local assessors to be the total taxable value of land and additions on the property. | Land | Improvement |
|---|---|---|---|---|
| 2024 | $2,178 | $79,410 | $6,040 | $73,370 |
| 2023 | $1,625 | $57,140 | $5,650 | $51,490 |
| 2022 | $1,640 | $57,137 | $5,649 | $51,488 |
| 2021 | $1,633 | $57,137 | $5,649 | $51,488 |
| 2020 | $1,584 | $57,350 | $5,650 | $51,700 |
| 2019 | $1,588 | $57,350 | $5,650 | $51,700 |
| 2018 | $1,580 | $57,350 | $5,650 | $51,700 |
| 2017 | $1,618 | $56,810 | $5,480 | $51,330 |
| 2016 | $1,622 | $56,810 | $5,480 | $51,330 |
| 2015 | $1,873 | $62,520 | $5,480 | $57,040 |
| 2014 | $1,555 | $53,320 | $4,980 | $48,340 |
| 2013 | $1,524 | $53,320 | $4,980 | $48,340 |
Source: Public Records
Map
Nearby Homes
- 203 Morristown Flushing Rd
- 0 Pearl St
- 117 A&B High St
- 0 Holloway Rd State Rt 331 Unit 5067951
- 42921 Harrah St
- 41091 Nicki Lynn Dr
- 72018 Uniontown Flushing Rd
- 40900 Havenwood Dr
- INLOT 19 Havenwood
- 67380 National New Lafferty Rd
- 67290 National New Lafferty Rd
- 0 National Rd Unit 5154946
- 39991 National Rd
- 0 National Rd
- 34810 Nelson Dr
- 44005 Lude Rd
- 19 acres Saffell Rd
- 15 acres Saffell Rd
- 35 acres Saffell Rd
- 66164 Belmont Morristown Rd
- 71138 Morristown Flushing Rd
- 39751 County Road 72
- 71142 Morristown Flushing Rd
- 39480 Morristown Flushing Rd
- 71053 Morristown Flushing Rd
- 39475 Six Mile Run Rd
- 71180 Morristown Flushing Rd
- 39721 County Road 72
- 71041 Morristown Flushing Rd
- 71190 Morristown Flushing Rd
- 71032 Morristown Flushing Rd
- 71230 Morristown Flushing Rd
- 70998 Morristown Flushing Rd
- 70974 Morristown Flushing Rd
- 39700 Belmont Ridge Rd
- 71250 Morristown Flushing Rd
- 39689 County Road 72
- 70920 Morristown Flushing Rd
- 70924 Morristown Flushing Rd
- 71305 Morristown Flushing Rd