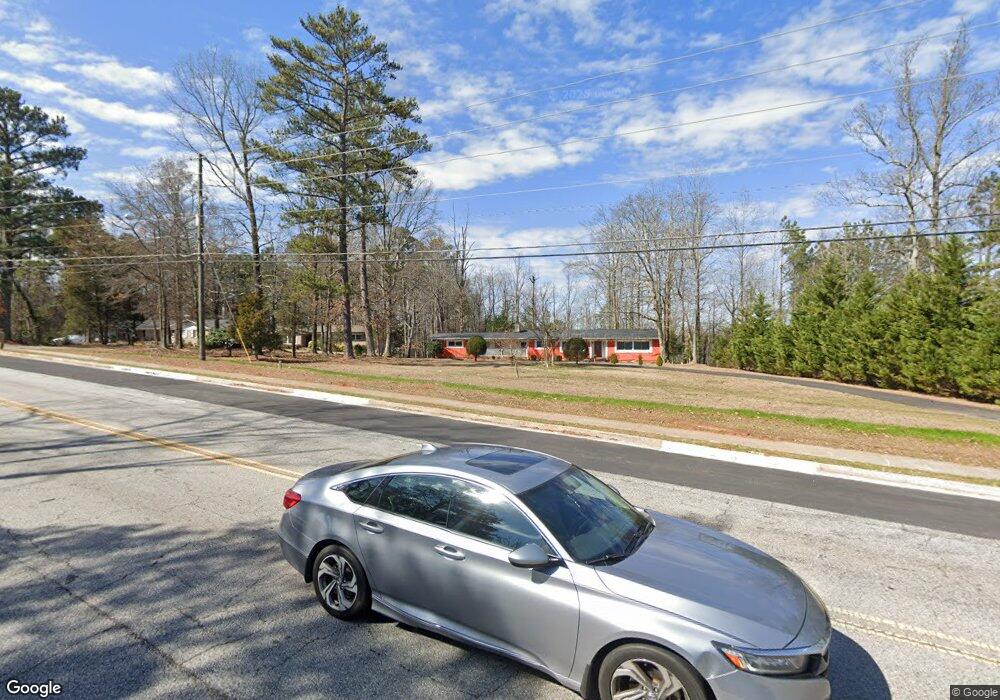
7114 Factory Shoals Rd Austell, GA 30168
Estimated Value: $323,034 - $409,000
3
Beds
2
Baths
2,053
Sq Ft
$175/Sq Ft
Est. Value
About This Home
This home is located at 7114 Factory Shoals Rd, Austell, GA 30168 and is currently estimated at $358,259, approximately $174 per square foot. 7114 Factory Shoals Rd is a home located in Cobb County with nearby schools including Bryant Elementary School, Lindley Middle School, and Pebblebrook High School.
Ownership History
Date
Name
Owned For
Owner Type
Purchase Details
Closed on
Mar 23, 2011
Sold by
Hud & Housing Of Urban Dev
Bought by
Boyzo Guadalupe
Current Estimated Value
Purchase Details
Closed on
Jun 1, 2010
Sold by
Wells Fargo Bk Na
Bought by
Hud-Housing Of Urban Dev
Purchase Details
Closed on
Apr 26, 2007
Sold by
Serrato Jose A
Bought by
Serrato Jose A and Ventura Javier
Home Financials for this Owner
Home Financials are based on the most recent Mortgage that was taken out on this home.
Original Mortgage
$177,219
Interest Rate
6.12%
Mortgage Type
FHA
Purchase Details
Closed on
Oct 19, 2005
Sold by
Gaither J D and Gaither Mary P
Bought by
Williams Michael L and Williams Angela T
Create a Home Valuation Report for This Property
The Home Valuation Report is an in-depth analysis detailing your home's value as well as a comparison with similar homes in the area
Home Values in the Area
Average Home Value in this Area
Purchase History
| Date | Buyer | Sale Price | Title Company |
|---|---|---|---|
| Boyzo Guadalupe | $42,000 | -- | |
| Hud-Housing Of Urban Dev | -- | -- | |
| Wells Fargo Bk | $181,415 | -- | |
| Serrato Jose A | -- | -- | |
| Serrato Jose A | $180,000 | -- | |
| Williams Michael L | $77,900 | -- |
Source: Public Records
Mortgage History
| Date | Status | Borrower | Loan Amount |
|---|---|---|---|
| Previous Owner | Serrato Jose A | $177,219 |
Source: Public Records
Tax History Compared to Growth
Tax History
| Year | Tax Paid | Tax Assessment Tax Assessment Total Assessment is a certain percentage of the fair market value that is determined by local assessors to be the total taxable value of land and additions on the property. | Land | Improvement |
|---|---|---|---|---|
| 2025 | $501 | $117,828 | $42,560 | $75,268 |
| 2024 | $503 | $117,828 | $42,560 | $75,268 |
| 2023 | $213 | $89,376 | $39,200 | $50,176 |
| 2022 | $388 | $79,296 | $29,120 | $50,176 |
| 2021 | $350 | $66,448 | $23,520 | $42,928 |
| 2020 | $330 | $59,728 | $16,800 | $42,928 |
| 2019 | $1,269 | $59,728 | $16,800 | $42,928 |
| 2018 | $798 | $38,204 | $8,960 | $29,244 |
| 2017 | $772 | $38,204 | $8,960 | $29,244 |
| 2016 | $718 | $35,692 | $8,400 | $27,292 |
| 2015 | $629 | $30,944 | $5,600 | $25,344 |
| 2014 | $827 | $27,840 | $0 | $0 |
Source: Public Records
Map
Nearby Homes
- 7151 Springchase Way
- 761 Knox Springs Rd
- 7249 Factory Shoals Rd
- 7282 Rockhouse Rd Unit 5
- 796 Crestside Ct Unit 1
- Townhomes at Crestview Floorplan at Crestview - Townhomes
- 7224 Crestside Dr Unit 1
- 7238 Crestside Dr Unit 79
- 937 Pine Oak Trail
- 760 Wade Farm Dr
- 967 Pine Hollow Rd
- 6914 Fairway Trail
- 7063 Pleasant Dr
- 7098 Pleasant Dr
- 295 Sweetshrub Dr Unit 2
- 7067 Pleasant Dr
- 7074 Oakhill Cir
- 7080 Fringe Flower Dr Unit 18
- 7010 Oakhill Cir
- 7066 Oakhill Cir
- 7114 Factory Shoals Rd
- 613 Tomahawk Place
- 609 Tomahawk Place
- 7126 Factory Shoals Rd
- 605 Tomahawk Pl
- 617 Tomahawk Place
- 601 Tomahawk Place
- 7142 Factory Shoals Rd
- 612 Tomahawk Place
- 7100 Southface Way
- 7106 Southface Way
- 7055 Shoals Way
- 7094 Southface Way
- 7112 Southface Way
- 7088 Southface Way SW
- 7082 Southface Way SW
- 616 Tomahawk Place
- 7011 Olivia Point
- 7059 Shoals Way
- 7076 Southface Way SW Unit 43