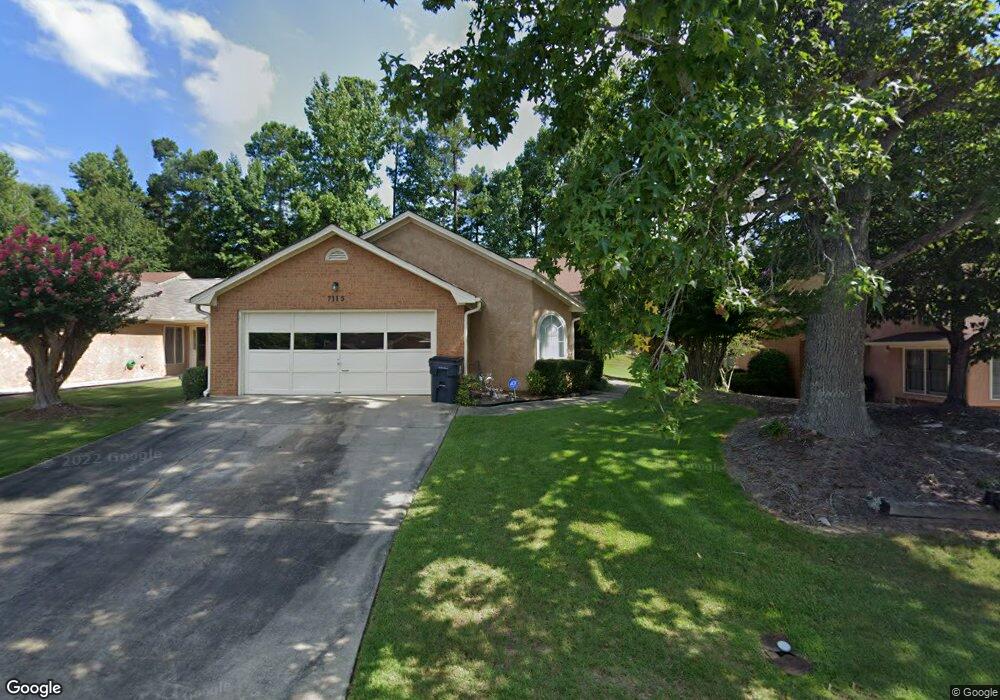
7115 Woodridge Ln Unit 7115 Union City, GA 30291
Estimated Value: $233,000 - $267,495
3
Beds
3
Baths
1,889
Sq Ft
$132/Sq Ft
Est. Value
About This Home
This home is located at 7115 Woodridge Ln Unit 7115, Union City, GA 30291 and is currently estimated at $249,374, approximately $132 per square foot. 7115 Woodridge Ln Unit 7115 is a home located in Fulton County with nearby schools including Oakley Elementary School, Bear Creek Middle School, and Creekside High School.
Ownership History
Date
Name
Owned For
Owner Type
Purchase Details
Closed on
Nov 25, 2024
Sold by
Brown Josephine E
Bought by
Pipkin Josephine E
Current Estimated Value
Home Financials for this Owner
Home Financials are based on the most recent Mortgage that was taken out on this home.
Original Mortgage
$360,000
Outstanding Balance
$359,799
Interest Rate
6.32%
Mortgage Type
New Conventional
Estimated Equity
-$110,425
Purchase Details
Closed on
Apr 10, 2018
Sold by
Brown George A
Bought by
Brown Josephine E
Purchase Details
Closed on
Jun 30, 2010
Sold by
Phillips Margaret F
Bought by
Brown George A and Brown Josephine E
Home Financials for this Owner
Home Financials are based on the most recent Mortgage that was taken out on this home.
Original Mortgage
$93,279
Interest Rate
4.75%
Mortgage Type
FHA
Create a Home Valuation Report for This Property
The Home Valuation Report is an in-depth analysis detailing your home's value as well as a comparison with similar homes in the area
Home Values in the Area
Average Home Value in this Area
Purchase History
| Date | Buyer | Sale Price | Title Company |
|---|---|---|---|
| Pipkin Josephine E | -- | -- | |
| Brown Josephine E | $76,700 | -- | |
| Brown George A | $95,000 | -- |
Source: Public Records
Mortgage History
| Date | Status | Borrower | Loan Amount |
|---|---|---|---|
| Open | Pipkin Josephine E | $360,000 | |
| Closed | Pipkin Josephine E | $360,000 | |
| Previous Owner | Brown George A | $93,279 |
Source: Public Records
Tax History Compared to Growth
Tax History
| Year | Tax Paid | Tax Assessment Tax Assessment Total Assessment is a certain percentage of the fair market value that is determined by local assessors to be the total taxable value of land and additions on the property. | Land | Improvement |
|---|---|---|---|---|
| 2025 | -- | $108,320 | $12,960 | $95,360 |
| 2023 | $2,325 | $82,360 | $14,760 | $67,600 |
| 2022 | $2,062 | $73,040 | $12,120 | $60,920 |
| 2021 | $1,481 | $53,120 | $9,880 | $43,240 |
| 2020 | $1,481 | $52,480 | $9,760 | $42,720 |
| 2019 | $1,325 | $46,960 | $6,360 | $40,600 |
| 2018 | $866 | $38,840 | $4,800 | $34,040 |
| 2017 | $895 | $30,680 | $5,520 | $25,160 |
| 2016 | $895 | $30,680 | $5,520 | $25,160 |
| 2015 | $899 | $30,680 | $5,520 | $25,160 |
| 2014 | $868 | $28,320 | $5,080 | $23,240 |
Source: Public Records
Map
Nearby Homes
- 7125 Woodridge Ln
- 6340 Hickory Lane Cir
- 6338 Hickory Lane Cir
- 7105 Boulder Pass
- 6229 Hickory Lane Cir
- 6271 Hickory Lane Cir
- 6231 Hickory Lane Cir
- 6256 Hickory Lane Cir
- 7259 Taloga Ln
- 4509 Gideons Trace
- 4203 Jordans Bank
- 4509 Gideon's Trace
- 7317 Gossamer St
- 4403 Pinscher St
- 4230 Vinca Way
- 310 Ashigan St
- 328 Ashigan St
- 329 Ashigan St
- 7115 Woodridge Ln
- 7117 Woodridge Ln
- 7113 Woodridge Ln
- 7119 Woodridge Ln
- 7111 Woodridge Ln
- 7121 Woodridge Ln
- 721 Stony Ln
- 7109 Woodridge Ln
- 720 Stony Ln
- 7116 Woodridge Ln
- 7114 Woodridge Ln
- 7118 Woodridge Ln
- 7107 Woodridge Ln
- 7108 Woodridge Ln
- 7120 Woodridge Ln
- 7106 Woodridge Ln
- 7122 Woodridge Ln
- 717 Stony Ln
- 7105 Woodridge Ln
- 7104 Woodridge Ln