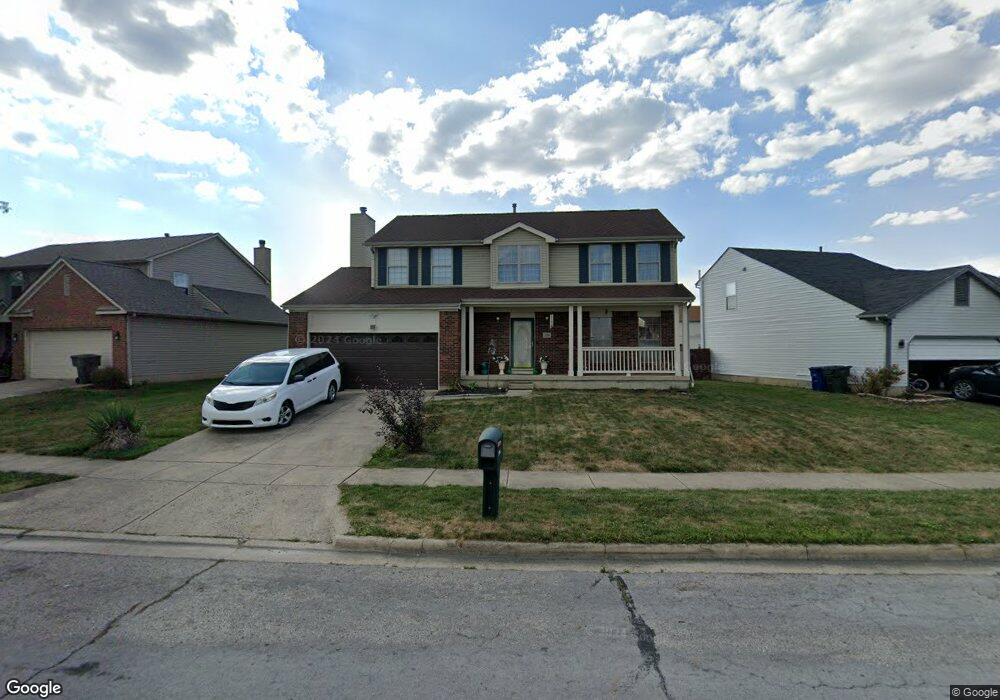
7116 Bennell Dr Reynoldsburg, OH 43068
Estimated Value: $361,000 - $396,000
4
Beds
3
Baths
2,248
Sq Ft
$166/Sq Ft
Est. Value
About This Home
This home is located at 7116 Bennell Dr, Reynoldsburg, OH 43068 and is currently estimated at $372,603, approximately $165 per square foot. 7116 Bennell Dr is a home located in Fairfield County with nearby schools including Tussing Elementary School, Harmon Middle School, and Pickerington Ridgeview Junior High School.
Ownership History
Date
Name
Owned For
Owner Type
Purchase Details
Closed on
Jan 21, 2005
Sold by
Yen Simon F and Yen Wen
Bought by
Smith Stephanie A
Current Estimated Value
Home Financials for this Owner
Home Financials are based on the most recent Mortgage that was taken out on this home.
Original Mortgage
$169,900
Outstanding Balance
$80,747
Interest Rate
4.87%
Mortgage Type
Unknown
Estimated Equity
$291,856
Purchase Details
Closed on
May 2, 2001
Sold by
Eaglin Brian E
Bought by
Yen Wen and Yen Simon F
Home Financials for this Owner
Home Financials are based on the most recent Mortgage that was taken out on this home.
Original Mortgage
$100,000
Interest Rate
6.95%
Mortgage Type
New Conventional
Purchase Details
Closed on
Oct 5, 1999
Sold by
Bradford John A
Bought by
Eaglin Brian E and Eaglin Cherriss
Home Financials for this Owner
Home Financials are based on the most recent Mortgage that was taken out on this home.
Original Mortgage
$143,925
Interest Rate
7.93%
Mortgage Type
New Conventional
Purchase Details
Closed on
Aug 27, 1996
Sold by
Homewood Building Co
Bought by
Bradford John A and Bradford Barbara A
Home Financials for this Owner
Home Financials are based on the most recent Mortgage that was taken out on this home.
Original Mortgage
$129,400
Interest Rate
8.47%
Mortgage Type
New Conventional
Create a Home Valuation Report for This Property
The Home Valuation Report is an in-depth analysis detailing your home's value as well as a comparison with similar homes in the area
Home Values in the Area
Average Home Value in this Area
Purchase History
| Date | Buyer | Sale Price | Title Company |
|---|---|---|---|
| Smith Stephanie A | $169,900 | -- | |
| Yen Wen | $149,000 | -- | |
| Eaglin Brian E | $151,500 | -- | |
| Bradford John A | $136,212 | -- |
Source: Public Records
Mortgage History
| Date | Status | Borrower | Loan Amount |
|---|---|---|---|
| Open | Smith Stephanie A | $169,900 | |
| Previous Owner | Yen Wen | $100,000 | |
| Previous Owner | Eaglin Brian E | $143,925 | |
| Previous Owner | Bradford John A | $129,400 |
Source: Public Records
Tax History Compared to Growth
Tax History
| Year | Tax Paid | Tax Assessment Tax Assessment Total Assessment is a certain percentage of the fair market value that is determined by local assessors to be the total taxable value of land and additions on the property. | Land | Improvement |
|---|---|---|---|---|
| 2024 | $9,184 | $93,290 | $14,910 | $78,380 |
| 2023 | $3,629 | $93,290 | $14,910 | $78,380 |
| 2022 | $3,639 | $93,290 | $14,910 | $78,380 |
| 2021 | $3,233 | $71,570 | $11,470 | $60,100 |
| 2020 | $3,270 | $71,570 | $11,470 | $60,100 |
| 2019 | $3,293 | $71,570 | $11,470 | $60,100 |
| 2018 | $2,858 | $55,960 | $10,510 | $45,450 |
| 2017 | $2,861 | $54,850 | $9,560 | $45,290 |
| 2016 | $2,838 | $54,850 | $9,560 | $45,290 |
| 2015 | $2,711 | $49,800 | $9,560 | $40,240 |
| 2014 | $2,669 | $49,800 | $9,560 | $40,240 |
| 2013 | $2,669 | $49,800 | $9,560 | $40,240 |
Source: Public Records
Map
Nearby Homes
- 3099 Ambarwent Rd
- 3072 Bocastle Ct
- 6926 Bennell Dr
- 3292 Draycott Ct
- 3188 Creighton Place
- 3265 O'Heagra Dr
- 3021 Sumner Dr
- 3124 Creighton Place
- 3205 Mahaffey Ct
- 7287 Candlestone Dr
- 7350 Aplin Dr
- 3233 Mahaffey Ct
- 3212 Southern Hills Dr
- 3358 Cargin Ct
- 3133 Earlington Ln
- 6775 Centennial Dr
- 3161 Innisbrook Ct
- 2826-2828 Continental Dr
- 2909 Princeville Dr
- 3624 Peany Ln
- 7122 Bennell Dr
- 7108 Bennell Dr
- 7128 Bennell Dr
- 7098 Bennell Dr
- 3146 Arborsye Ct
- 3140 Arborsye Ct
- 7110 Dewfall Dr
- 3152 Arborsye Ct
- 7134 Bennell Dr
- 7088 Bennell Dr
- 7091 Dewfall Dr
- 7113 Bennell Dr
- 3134 Arborsye Ct
- 3158 Arborsye Ct
- 7118 Dewfall Dr
- 7140 Bennell Dr
- 7121 Bennell Dr
- 7099 Bennell Dr
- 7078 Bennell Dr
- 7129 Bennell Dr