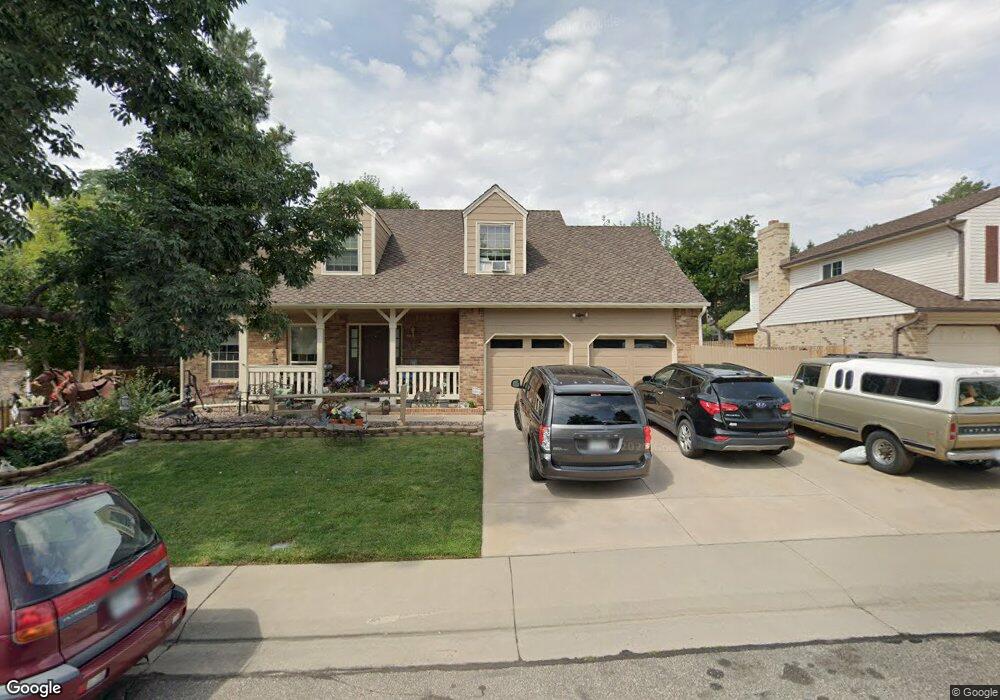
7117 Flora St Arvada, CO 80004
Ralston Valley NeighborhoodEstimated Value: $666,084 - $794,000
3
Beds
3
Baths
2,048
Sq Ft
$351/Sq Ft
Est. Value
About This Home
This home is located at 7117 Flora St, Arvada, CO 80004 and is currently estimated at $719,521, approximately $351 per square foot. 7117 Flora St is a home located in Jefferson County with nearby schools including Van Arsdale Elementary School, Oberon Middle School, and Ralston Valley Senior High School.
Ownership History
Date
Name
Owned For
Owner Type
Purchase Details
Closed on
Jul 25, 2003
Sold by
Noska Shirley A and Noska James
Bought by
Noska Shirley A and Noska James L
Current Estimated Value
Home Financials for this Owner
Home Financials are based on the most recent Mortgage that was taken out on this home.
Original Mortgage
$241,600
Outstanding Balance
$102,174
Interest Rate
5.19%
Mortgage Type
Purchase Money Mortgage
Estimated Equity
$617,347
Purchase Details
Closed on
Dec 14, 2001
Sold by
Noska James L and Noska Shirley A
Bought by
Noska Shirley A
Home Financials for this Owner
Home Financials are based on the most recent Mortgage that was taken out on this home.
Original Mortgage
$245,000
Interest Rate
6.39%
Create a Home Valuation Report for This Property
The Home Valuation Report is an in-depth analysis detailing your home's value as well as a comparison with similar homes in the area
Home Values in the Area
Average Home Value in this Area
Purchase History
| Date | Buyer | Sale Price | Title Company |
|---|---|---|---|
| Noska Shirley A | -- | Land Title | |
| Noska Shirley A | -- | -- |
Source: Public Records
Mortgage History
| Date | Status | Borrower | Loan Amount |
|---|---|---|---|
| Open | Noska Shirley A | $241,600 | |
| Previous Owner | Noska Shirley A | $245,000 |
Source: Public Records
Tax History Compared to Growth
Tax History
| Year | Tax Paid | Tax Assessment Tax Assessment Total Assessment is a certain percentage of the fair market value that is determined by local assessors to be the total taxable value of land and additions on the property. | Land | Improvement |
|---|---|---|---|---|
| 2024 | $2,794 | $35,509 | $15,148 | $20,361 |
| 2023 | $2,794 | $35,509 | $15,148 | $20,361 |
| 2022 | $2,427 | $31,728 | $11,763 | $19,965 |
| 2021 | $2,467 | $32,642 | $12,102 | $20,540 |
| 2020 | $2,265 | $30,618 | $11,479 | $19,139 |
| 2019 | $2,234 | $30,618 | $11,479 | $19,139 |
| 2018 | $2,152 | $29,175 | $7,662 | $21,513 |
| 2017 | $1,970 | $29,175 | $7,662 | $21,513 |
| 2016 | $1,662 | $25,424 | $5,803 | $19,621 |
| 2015 | $1,446 | $25,424 | $5,803 | $19,621 |
| 2014 | $1,446 | $22,241 | $4,872 | $17,369 |
Source: Public Records
Map
Nearby Homes
- 14318 W 69th Place
- 7255 Devinney Ct Unit A
- 13970 W 72nd Place Unit C
- 13785 W 68th Dr
- 7491 Isabell Cir
- 7391 Coors Dr
- 6959 Joyce Ln Unit B
- 13784 W 67th Way
- 15007 W 68th Place Unit 29A
- 6892 Juniper Ct
- 15224 W 73rd Ave
- 6687 Devinney Ct
- 15152 W 69th Place
- 15334 W 69th Ave
- 15323 W 69th Ave
- Urban Paired Plan at Geos - Paired Homes
- Reihenhaus Plan at Geos - Townhomes
- Sonnenvilla Plan at Geos - Single Family Homes
- Solstice Plan at Geos - Townhomes
- 15312 W 69th Place
- 7127 Flora St
- 7107 Flora St
- 7118 Gardenia St
- 7138 N Gardenia St
- 7108 Gardenia St
- 7108 N Gardenia St
- 7128 Gardenia St
- 7131 Flora St
- 14273 W 71st Ave
- 7116 Flora St
- 7126 Flora St
- 14336 W 71st Dr
- 7130 Flora St
- 14340 W 71st Ave
- 14320 W 71st Ave
- 14366 W 71st Dr
- 7138 Gardenia St
- 14360 W 71st Ave
- 14280 W 71st Ave
- 14396 W 71st Dr