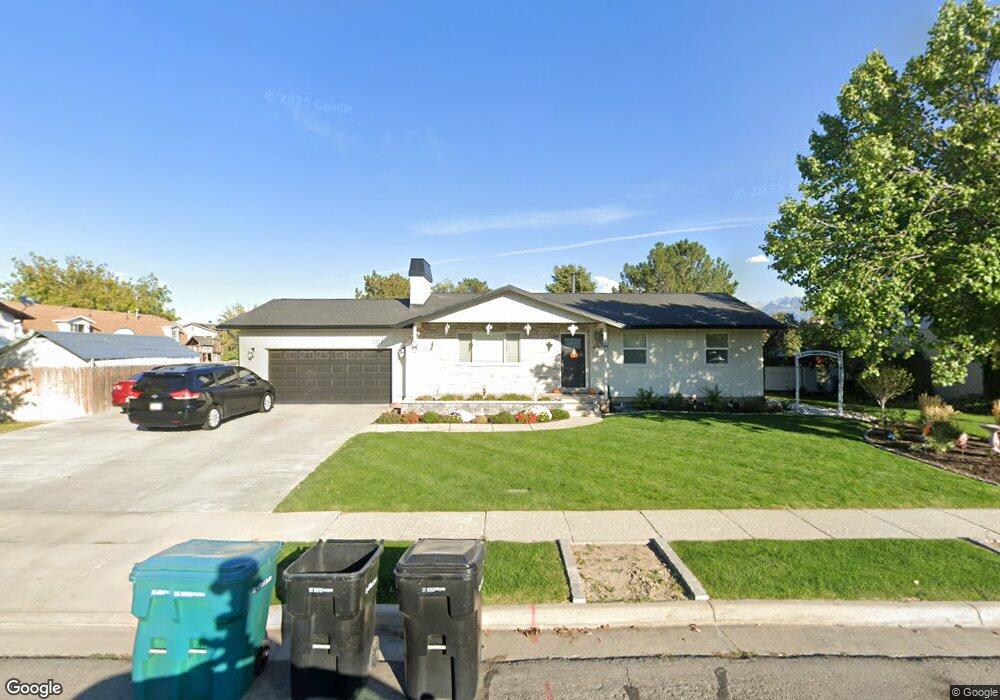
7117 S Woodgreen Rd West Jordan, UT 84084
Estimated Value: $525,000 - $585,000
4
Beds
2
Baths
2,494
Sq Ft
$220/Sq Ft
Est. Value
About This Home
This home is located at 7117 S Woodgreen Rd, West Jordan, UT 84084 and is currently estimated at $549,708, approximately $220 per square foot. 7117 S Woodgreen Rd is a home located in Salt Lake County with nearby schools including Oquirrh Elementary School, Joel P. Jensen Middle School, and West Jordan High School.
Ownership History
Date
Name
Owned For
Owner Type
Purchase Details
Closed on
May 14, 2020
Sold by
Frandsen Christine C
Bought by
Tamayo Marco Antonio Vazquez and Ramirez Martha A
Current Estimated Value
Home Financials for this Owner
Home Financials are based on the most recent Mortgage that was taken out on this home.
Original Mortgage
$348,570
Outstanding Balance
$308,881
Interest Rate
3.3%
Mortgage Type
FHA
Estimated Equity
$240,827
Purchase Details
Closed on
Dec 9, 2013
Sold by
Dunton Steven C
Bought by
Frandsen Christine C
Purchase Details
Closed on
Aug 8, 2001
Sold by
Frandsen Shaun W
Bought by
Frandsen Christine C
Purchase Details
Closed on
Mar 6, 1998
Sold by
Frandsen Shaun Wesley and Frandsen Christine C
Bought by
Frandsen Shaun W and Frandsen Christine C
Home Financials for this Owner
Home Financials are based on the most recent Mortgage that was taken out on this home.
Original Mortgage
$95,000
Interest Rate
6.69%
Create a Home Valuation Report for This Property
The Home Valuation Report is an in-depth analysis detailing your home's value as well as a comparison with similar homes in the area
Home Values in the Area
Average Home Value in this Area
Purchase History
| Date | Buyer | Sale Price | Title Company |
|---|---|---|---|
| Tamayo Marco Antonio Vazquez | -- | First American Title | |
| Frandsen Christine C | -- | None Available | |
| Frandsen Christine C | -- | Associated Title | |
| Frandsen Shaun W | -- | -- |
Source: Public Records
Mortgage History
| Date | Status | Borrower | Loan Amount |
|---|---|---|---|
| Open | Tamayo Marco Antonio Vazquez | $348,570 | |
| Previous Owner | Frandsen Shaun W | $95,000 |
Source: Public Records
Tax History Compared to Growth
Tax History
| Year | Tax Paid | Tax Assessment Tax Assessment Total Assessment is a certain percentage of the fair market value that is determined by local assessors to be the total taxable value of land and additions on the property. | Land | Improvement |
|---|---|---|---|---|
| 2025 | $2,551 | $511,400 | $169,300 | $342,100 |
| 2024 | $2,551 | $490,800 | $162,200 | $328,600 |
| 2023 | $2,572 | $466,400 | $153,000 | $313,400 |
| 2022 | $2,583 | $460,800 | $150,000 | $310,800 |
| 2021 | $2,176 | $353,400 | $115,000 | $238,400 |
| 2020 | $1,890 | $288,100 | $115,000 | $173,100 |
| 2019 | $1,886 | $281,800 | $90,000 | $191,800 |
| 2018 | $1,770 | $262,400 | $86,900 | $175,500 |
| 2017 | $1,542 | $227,500 | $86,900 | $140,600 |
| 2016 | $1,484 | $205,800 | $86,900 | $118,900 |
| 2015 | $1,423 | $192,400 | $86,100 | $106,300 |
| 2014 | $1,402 | $186,600 | $84,500 | $102,100 |
Source: Public Records
Map
Nearby Homes
- 6980 S 3535 W Unit 2
- 6968 S 3535 W Unit 3
- 3383 W 6880 S
- 6992 W Terraine Rd
- 6978 W Terraine Rd
- 6863 S Dixie Dr
- 7458 Bromley Rd
- 6893 S 3200 W
- 6672 S 3335 W
- 8524 S Michele River Ave W Unit 109
- 6788 Valence Ln
- 7611 S Springbrook Dr
- 3660 Ashland Cir
- 3422 Briar Dr
- 3695 Carolina Dr
- 6622 S Georgia Dr
- 7604 S Autumn Dr
- 3963 W Hollandia Ln
- 3770 W Carolina Dr
- 6482 S Gold Medal Dr
- 7117 Woodgreen Rd
- 7129 Woodgreen Rd
- 7105 Woodgreen Rd
- 3438 W Erica Cir
- 3438 Erica Cir
- 3455 Millerberg Way
- 3442 Erica Cir
- 7141 Woodgreen Rd
- 3443 Millerberg Way
- 7122 Woodgreen Rd
- 7112 Woodgreen Rd
- 7134 S Woodgreen Rd
- 7134 Woodgreen Rd
- 7120 Bromley Rd
- 7120 S Bromley Rd
- 3491 Millerberg Way
- 3437 W Erica Cir
- 3437 Erica Cir
- 7106 S Bromley Rd
- 7106 Bromley Rd