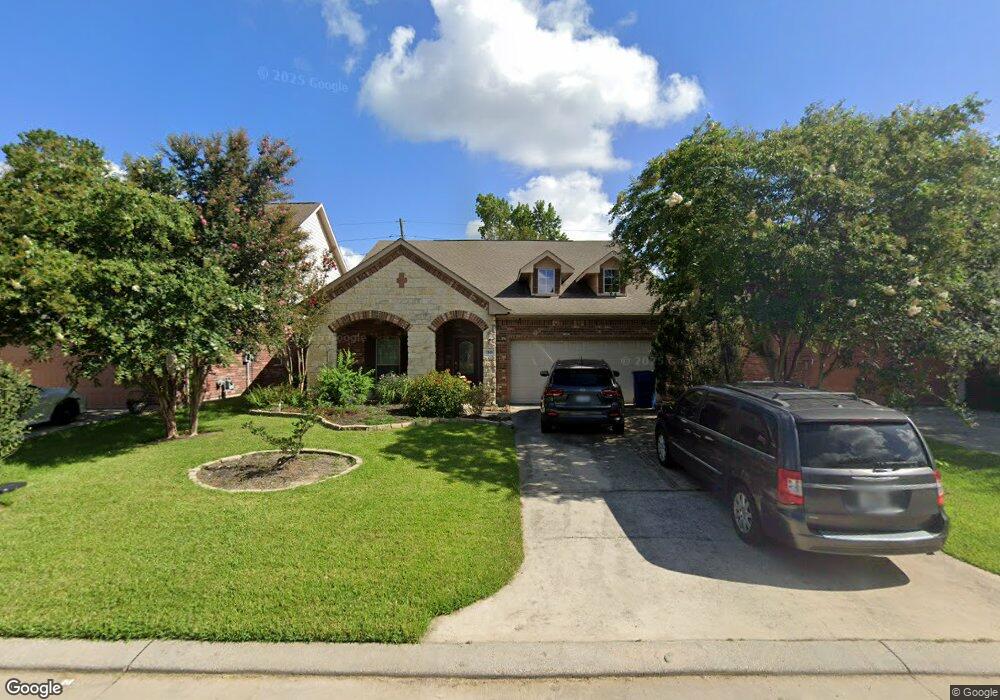
7118 Casita Dr Magnolia, TX 77354
Estimated Value: $286,000 - $335,000
--
Bed
--
Bath
2,022
Sq Ft
$150/Sq Ft
Est. Value
About This Home
This home is located at 7118 Casita Dr, Magnolia, TX 77354 and is currently estimated at $302,454, approximately $149 per square foot. 7118 Casita Dr is a home located in Montgomery County with nearby schools including Bear Branch Elementary School, Bear Branch Junior High School, and Magnolia High School.
Ownership History
Date
Name
Owned For
Owner Type
Purchase Details
Closed on
Mar 19, 2020
Sold by
Daniels Janice M
Bought by
Mims Robert L
Current Estimated Value
Purchase Details
Closed on
Mar 4, 2020
Sold by
Daniels Janice M
Bought by
Mims Robert L
Purchase Details
Closed on
Nov 15, 2007
Sold by
Wall Homes Texas Llc
Bought by
Mims Robert L
Home Financials for this Owner
Home Financials are based on the most recent Mortgage that was taken out on this home.
Original Mortgage
$140,941
Interest Rate
6.42%
Mortgage Type
Purchase Money Mortgage
Purchase Details
Closed on
Jan 4, 2007
Sold by
Wall Homes Inc
Bought by
Mims Robert L and Mims Roberta M
Purchase Details
Closed on
Nov 17, 2006
Sold by
Honea Egypt Venture Ltd
Bought by
Mims Robert L and Mims Roberta M
Create a Home Valuation Report for This Property
The Home Valuation Report is an in-depth analysis detailing your home's value as well as a comparison with similar homes in the area
Home Values in the Area
Average Home Value in this Area
Purchase History
| Date | Buyer | Sale Price | Title Company |
|---|---|---|---|
| Mims Robert L | -- | None Listed On Document | |
| Mims Robert L | -- | None Listed On Document | |
| Mims Robert L | -- | Fidelity National Title | |
| Mims Robert L | -- | -- | |
| Mims Robert L | -- | -- |
Source: Public Records
Mortgage History
| Date | Status | Borrower | Loan Amount |
|---|---|---|---|
| Previous Owner | Mims Robert L | $140,941 | |
| Closed | Mims Robert L | $0 |
Source: Public Records
Tax History Compared to Growth
Tax History
| Year | Tax Paid | Tax Assessment Tax Assessment Total Assessment is a certain percentage of the fair market value that is determined by local assessors to be the total taxable value of land and additions on the property. | Land | Improvement |
|---|---|---|---|---|
| 2025 | $2,451 | $310,586 | $42,500 | $268,086 |
| 2024 | $2,332 | $308,058 | $42,500 | $265,558 |
| 2023 | $2,332 | $282,990 | $42,500 | $279,470 |
| 2022 | $4,540 | $257,260 | $42,500 | $254,270 |
| 2021 | $4,347 | $233,870 | $42,500 | $191,370 |
| 2020 | $4,614 | $227,980 | $26,260 | $201,720 |
| 2019 | $4,496 | $223,250 | $26,260 | $196,990 |
| 2018 | $3,181 | $208,860 | $26,260 | $182,600 |
| 2017 | $4,429 | $208,860 | $26,260 | $182,600 |
| 2016 | $4,307 | $203,100 | $26,260 | $176,840 |
| 2015 | $3,781 | $202,390 | $26,260 | $176,130 |
| 2014 | $3,781 | $186,260 | $26,260 | $160,000 |
Source: Public Records
Map
Nearby Homes
- 6818 Woodland Oaks
- 6902 Woodland Oaks
- 6910 Woodland Oaks
- 7002 Durango Creek Dr
- 7010 Durango Dr
- 723 Hinsdale
- 6846 Durango Creek Dr
- 6906 Grant Dr
- 7119 Durango Dr
- 7455 Durango Creek Dr
- 7203 Cool Springs Ct
- 6626 Grant Dr
- 7022 Dillon Dr
- 7215 Autumn Day Ct
- 6718 Durango Creek Dr
- 33127 Cottonwood Bend
- 6706 Durango Creek Dr
- 247 Brazen Forest Trail
- 222 Brazen Forest Trail
- 203 Brazen Forest Trail
- 7114 Casita Dr
- 7122 Casita Dr
- 7110 Casita Dr
- 7126 Casita Dr
- 7123 Casita Dr
- 7106 Casita Dr
- 7127 Casita Dr
- 7119 Casita Dr
- 7115 Casita Dr
- 7111 Casita Dr
- 7130 Casita Dr
- 6819 Woodland Oaks
- 7131 Casita Dr
- 6815 Woodland Oaks
- 7102 Casita Dr
- 7107 Casita Dr
- 7103 Casita Dr
- 6823 Woodland Oaks
- 6811 Woodland Oaks
- 7202 Casita Dr