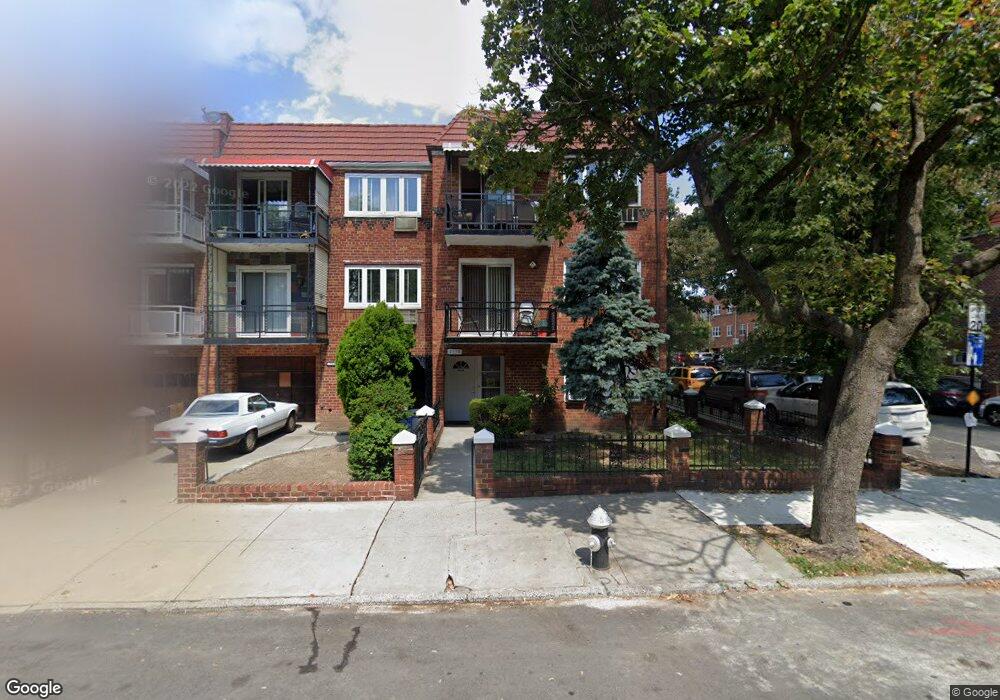
7119 31st Ave East Elmhurst, NY 11370
Jackson Heights NeighborhoodEstimated Value: $1,350,000 - $1,495,000
--
Bed
--
Bath
3,366
Sq Ft
$421/Sq Ft
Est. Value
About This Home
This home is located at 7119 31st Ave, East Elmhurst, NY 11370 and is currently estimated at $1,416,333, approximately $420 per square foot. 7119 31st Ave is a home located in Queens County with nearby schools including Ps 152 Gwendolyn N Alleyne School, I.S. 230, and William Cullen Bryant High School.
Ownership History
Date
Name
Owned For
Owner Type
Purchase Details
Closed on
May 30, 2025
Sold by
Scarimbolo Family Ii Llc
Bought by
Scarimbolo Joseph
Current Estimated Value
Home Financials for this Owner
Home Financials are based on the most recent Mortgage that was taken out on this home.
Original Mortgage
$475,000
Outstanding Balance
$473,781
Interest Rate
6.81%
Mortgage Type
Purchase Money Mortgage
Estimated Equity
$942,552
Purchase Details
Closed on
Jun 28, 2021
Sold by
Scarimbolo Joseph
Bought by
Scarimbolo Family Ii Llc
Purchase Details
Closed on
Feb 3, 2020
Sold by
Scarimbolo Ii Llc
Bought by
Scarimbolo Joseph
Purchase Details
Closed on
Dec 1, 2018
Sold by
Scarimbolo Joseph
Bought by
Scarimbolo Family Ii Llc
Purchase Details
Closed on
Aug 27, 2018
Sold by
Scarimbolo Family Ii Llc
Bought by
Scarimbolo Joseph
Purchase Details
Closed on
May 31, 2010
Sold by
Scarimbolo Carlo and Scarimbolo Rita
Bought by
Scarimbolo Family Ii Llc
Create a Home Valuation Report for This Property
The Home Valuation Report is an in-depth analysis detailing your home's value as well as a comparison with similar homes in the area
Home Values in the Area
Average Home Value in this Area
Purchase History
| Date | Buyer | Sale Price | Title Company |
|---|---|---|---|
| Scarimbolo Joseph | -- | -- | |
| Scarimbolo Family Ii Llc | -- | -- | |
| Scarimbolo Joseph | -- | -- | |
| Scarimbolo Family Ii Llc | -- | -- | |
| Scarimbolo Joseph | -- | -- | |
| Scarimbolo Family Ii Llc | -- | -- | |
| Scarimbolo Family Ii Llc | -- | -- |
Source: Public Records
Mortgage History
| Date | Status | Borrower | Loan Amount |
|---|---|---|---|
| Open | Scarimbolo Joseph | $475,000 |
Source: Public Records
Tax History Compared to Growth
Tax History
| Year | Tax Paid | Tax Assessment Tax Assessment Total Assessment is a certain percentage of the fair market value that is determined by local assessors to be the total taxable value of land and additions on the property. | Land | Improvement |
|---|---|---|---|---|
| 2025 | $13,138 | $69,334 | $9,258 | $60,076 |
| 2024 | $13,138 | $65,410 | $9,154 | $56,256 |
| 2023 | $12,394 | $61,709 | $8,169 | $53,540 |
| 2022 | $12,319 | $80,220 | $11,160 | $69,060 |
| 2021 | $12,889 | $85,800 | $11,160 | $74,640 |
| 2020 | $12,230 | $76,620 | $11,160 | $65,460 |
| 2019 | $11,403 | $76,620 | $11,160 | $65,460 |
| 2018 | $10,483 | $51,424 | $8,656 | $42,768 |
| 2017 | $10,483 | $51,424 | $9,800 | $41,624 |
| 2016 | $10,203 | $51,424 | $9,800 | $41,624 |
| 2015 | $5,851 | $48,148 | $12,022 | $36,126 |
| 2014 | $5,851 | $45,424 | $10,265 | $35,159 |
Source: Public Records
Map
Nearby Homes
- 7117 31st Ave
- 71-17 31st Ave Unit 3rd fl
- 7115 31st Ave
- 3054 72nd St
- 3054 72nd St
- 3054 72nd St Unit 3
- 3054 72nd St Unit 3rd Fl
- 3054 72nd St Unit 2
- 72-03 31st Ave
- 7111 31st Ave
- 3054 72nd St
- 7201 31st Ave
- 7109 31st Ave
- 3052 72nd St Unit 1
- 3052 72nd St Unit 2
- 30-52 72nd St Unit 2
- 3052 72nd St
- 30-50 72nd St Unit 1
- 30-50 72nd St
- 30-50 72nd St Unit 3