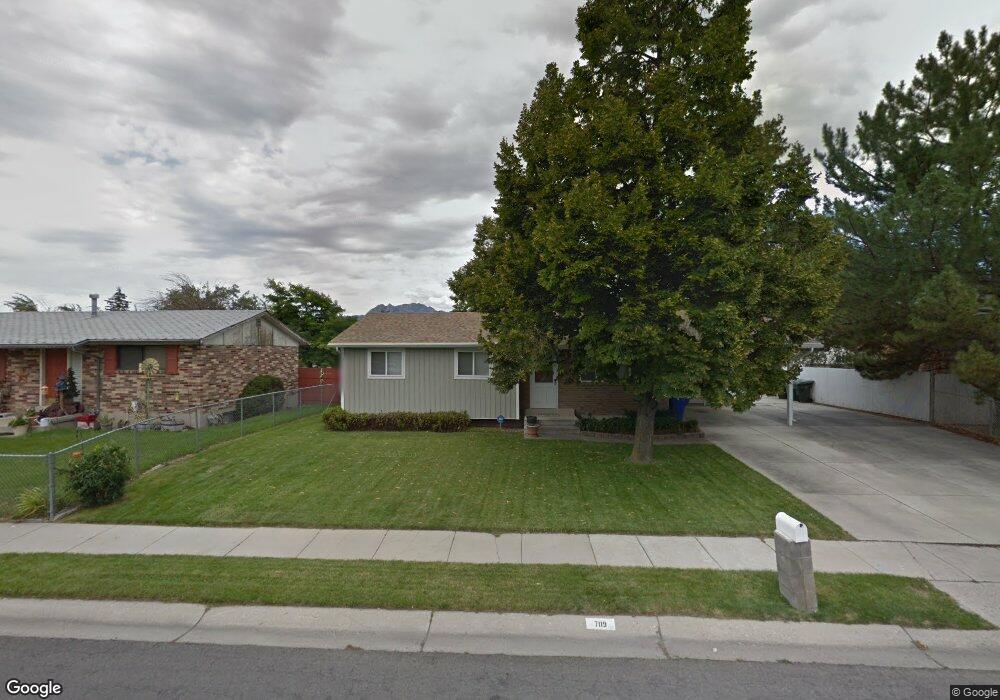
7119 Camelot Way West Jordan, UT 84084
Estimated Value: $447,000 - $476,171
2
Beds
1
Bath
990
Sq Ft
$461/Sq Ft
Est. Value
About This Home
This home is located at 7119 Camelot Way, West Jordan, UT 84084 and is currently estimated at $456,293, approximately $460 per square foot. 7119 Camelot Way is a home located in Salt Lake County with nearby schools including Majestic Elementary Arts Academy, West Jordan Middle School, and West Jordan High School.
Ownership History
Date
Name
Owned For
Owner Type
Purchase Details
Closed on
Aug 12, 2011
Sold by
Jensen Paula Y and Jensen Steve D
Bought by
Jensen Steve D
Current Estimated Value
Purchase Details
Closed on
Aug 26, 2004
Sold by
Jensen Paula Y
Bought by
Jensen Paula Y and Jensen Steve D
Home Financials for this Owner
Home Financials are based on the most recent Mortgage that was taken out on this home.
Original Mortgage
$105,000
Outstanding Balance
$52,262
Interest Rate
5.95%
Mortgage Type
Credit Line Revolving
Estimated Equity
$404,031
Purchase Details
Closed on
Oct 28, 1998
Sold by
Eoff Rick Burnett
Bought by
Eoff Paula Y
Home Financials for this Owner
Home Financials are based on the most recent Mortgage that was taken out on this home.
Original Mortgage
$29,500
Interest Rate
6.6%
Purchase Details
Closed on
Jun 18, 1993
Sold by
Eoff Rick B and Eoff Paula Y
Bought by
Eoff Paula Y
Create a Home Valuation Report for This Property
The Home Valuation Report is an in-depth analysis detailing your home's value as well as a comparison with similar homes in the area
Home Values in the Area
Average Home Value in this Area
Purchase History
| Date | Buyer | Sale Price | Title Company |
|---|---|---|---|
| Jensen Steve D | -- | None Available | |
| Jensen Paula Y | -- | Equity Title | |
| Jensen Paula Y | -- | -- | |
| Eoff Paula Y | -- | -- | |
| Eoff Paula Y | -- | -- |
Source: Public Records
Mortgage History
| Date | Status | Borrower | Loan Amount |
|---|---|---|---|
| Open | Jensen Paula Y | $105,000 | |
| Previous Owner | Eoff Paula Y | $29,500 |
Source: Public Records
Tax History Compared to Growth
Tax History
| Year | Tax Paid | Tax Assessment Tax Assessment Total Assessment is a certain percentage of the fair market value that is determined by local assessors to be the total taxable value of land and additions on the property. | Land | Improvement |
|---|---|---|---|---|
| 2025 | $2,190 | $437,600 | $135,700 | $301,900 |
| 2024 | $2,190 | $421,400 | $131,000 | $290,400 |
| 2023 | $2,100 | $380,700 | $124,700 | $256,000 |
| 2022 | $2,173 | $387,700 | $122,300 | $265,400 |
| 2021 | $1,863 | $302,500 | $99,800 | $202,700 |
| 2020 | $1,703 | $259,500 | $99,800 | $159,700 |
| 2019 | $1,708 | $255,300 | $99,800 | $155,500 |
| 2018 | $1,470 | $217,900 | $75,300 | $142,600 |
| 2017 | $1,368 | $201,900 | $75,300 | $126,600 |
| 2016 | $1,382 | $191,600 | $75,300 | $116,300 |
| 2015 | -- | $180,700 | $86,000 | $94,700 |
| 2014 | $1,276 | $169,900 | $81,900 | $88,000 |
Source: Public Records
Map
Nearby Homes
- 7149 S Camelot Way
- 7150 Camelot Way
- 1951 W 7125 S
- 7279 S Kenadi Ct
- 6925 S Lexington Dr
- 1718 W Trey Way Unit 2
- 1607 W Beamon St
- 6924 S 2160 W
- 7118 S Equator Ln Unit 14 B
- 2312 W Hidden Bend Cove Unit 107
- 7165 Callie Dr
- 7174 S 1380 W
- 7194 S 1380 W
- 6683 Alice Susanna Ln
- 1678 Leland Dr
- 2421 W 6900 S
- 1516 W 7470 S
- 1384 W 7290 S
- 1817 W 7600 S Unit I204
- 1801 W 7600 S Unit C201
- 7123 Camelot Way
- 7111 Camelot Way
- 1866 Gold Rush Cir
- 1872 W Gold Rush Cir
- 1872 Gold Rush Cir
- 7120 Camelot Way
- 7131 Camelot Way
- 7131 S Camelot Way
- 7099 Camelot Way
- 1865 Silverton Cir
- 7110 Camelot Way
- 1942 W 7125 S
- 1919 W 7125 S
- 1872 Silverton Cir
- 1852 Gold Rush Cir
- 1865 W Gold Rush Cir
- 1865 Gold Rush Cir
- 7092 Camelot Way
- 7149 Camelot Way
- 7087 S Camelot Way