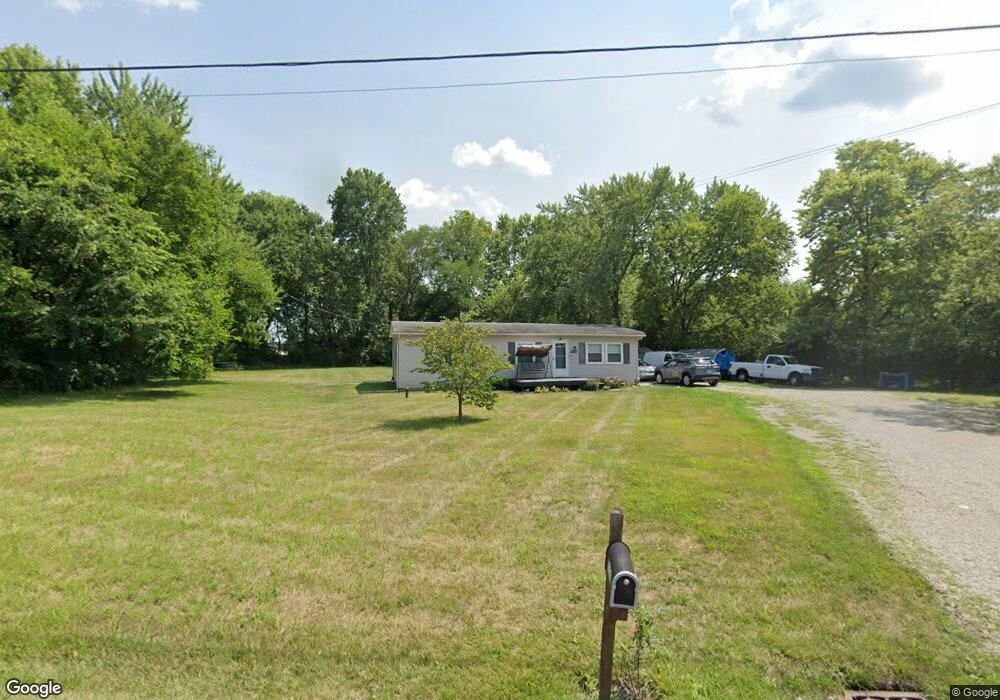
7119 Lambert Rd Orient, OH 43146
Estimated Value: $172,493 - $253,000
3
Beds
1
Bath
1,056
Sq Ft
$197/Sq Ft
Est. Value
About This Home
This home is located at 7119 Lambert Rd, Orient, OH 43146 and is currently estimated at $208,123, approximately $197 per square foot. 7119 Lambert Rd is a home located in Franklin County with nearby schools including Hayes Intermediate School, Darbydale Elementary School, and Pleasant View Middle School.
Ownership History
Date
Name
Owned For
Owner Type
Purchase Details
Closed on
Jun 9, 2005
Sold by
Mullins Jeanne N and Mullins Arlie Dewey
Bought by
Benedetto Rebecca L and Benedetto Christopher J
Current Estimated Value
Home Financials for this Owner
Home Financials are based on the most recent Mortgage that was taken out on this home.
Original Mortgage
$17,500
Outstanding Balance
$8,965
Interest Rate
5.87%
Mortgage Type
Stand Alone Second
Estimated Equity
$199,158
Purchase Details
Closed on
Aug 11, 2003
Sold by
Ward Jeffrey D
Bought by
Sellers Jeanne N
Home Financials for this Owner
Home Financials are based on the most recent Mortgage that was taken out on this home.
Original Mortgage
$23,000
Interest Rate
5.62%
Mortgage Type
Purchase Money Mortgage
Purchase Details
Closed on
Sep 27, 1991
Bought by
Ward Jeffrey D
Purchase Details
Closed on
May 10, 1991
Purchase Details
Closed on
Mar 1, 1987
Create a Home Valuation Report for This Property
The Home Valuation Report is an in-depth analysis detailing your home's value as well as a comparison with similar homes in the area
Home Values in the Area
Average Home Value in this Area
Purchase History
| Date | Buyer | Sale Price | Title Company |
|---|---|---|---|
| Benedetto Rebecca L | $87,500 | Chicago Tit | |
| Sellers Jeanne N | $75,900 | -- | |
| Ward Jeffrey D | -- | -- | |
| -- | -- | -- | |
| -- | -- | -- |
Source: Public Records
Mortgage History
| Date | Status | Borrower | Loan Amount |
|---|---|---|---|
| Open | Benedetto Rebecca L | $17,500 | |
| Closed | Sellers Jeanne N | $23,000 |
Source: Public Records
Tax History
| Year | Tax Paid | Tax Assessment Tax Assessment Total Assessment is a certain percentage of the fair market value that is determined by local assessors to be the total taxable value of land and additions on the property. | Land | Improvement |
|---|---|---|---|---|
| 2025 | $1,995 | $43,930 | $10,290 | $33,640 |
| 2024 | $1,995 | $43,930 | $10,290 | $33,640 |
| 2023 | $1,790 | $43,925 | $10,290 | $33,635 |
| 2022 | $1,825 | $32,410 | $6,160 | $26,250 |
| 2021 | $1,858 | $32,410 | $6,160 | $26,250 |
| 2020 | $1,849 | $32,410 | $6,160 | $26,250 |
| 2019 | $1,758 | $27,030 | $5,150 | $21,880 |
| 2018 | $1,870 | $27,030 | $5,150 | $21,880 |
| 2017 | $1,746 | $27,030 | $5,150 | $21,880 |
| 2016 | $1,989 | $28,150 | $8,440 | $19,710 |
| 2015 | $1,989 | $28,150 | $8,440 | $19,710 |
| 2014 | $1,990 | $28,150 | $8,440 | $19,710 |
| 2013 | $995 | $28,140 | $8,435 | $19,705 |
Source: Public Records
Map
Nearby Homes
- 5326 Sandpiper Dr
- 6446 Harrisburg Pike
- 7879 Railroad St
- 5514 Fairfield Rd
- 0 London Groveport Rd
- 5981 Main St
- 1063 Springlawn Ave
- 6106 London Groveport Rd Unit C9
- 6106 London Groveport Rd Unit C3
- 6946 Harrisburg London Rd
- 6965 Gay Rd
- 6244 London Groveport Rd Unit 96
- 6244 London Groveport Rd Unit 8
- 6616 London Groveport Rd
- 6259 Cherokee Ln
- 8681 Larkspur Dr
- 5600 Bellview Dr
- 5965 Harrisburg Georgesville Rd Unit 3
- 0 Burgett Rd
- 6774 Lewis Dr
- 7191 Harrisburg Pike
- 7117 Lambert Rd
- 7215 Harrisburg Pike
- 7197 Harrisburg Pike
- 7217 Harrisburg Pike
- 0 Harrisburg Pi
- 7225 Harrisburg Pike
- 7121 Lambert Rd
- 7301 Harrisburg Pike
- 7305 Harrisburg Pike
- 7377 Harrisburg Pike
- 7385 Harrisburg Pike
- 7391 Harrisburg Pike
- 5030 Patzer Ln
- 6997 Harrisburg Pike
- 7150 Stahl Rd
- 7425 Harrisburg Pike
- 6812 Thrasher Ct
- 6811 Thrasher Ct
- 7440 Old Harrisburg Rd
Your Personal Tour Guide
Ask me questions while you tour the home.