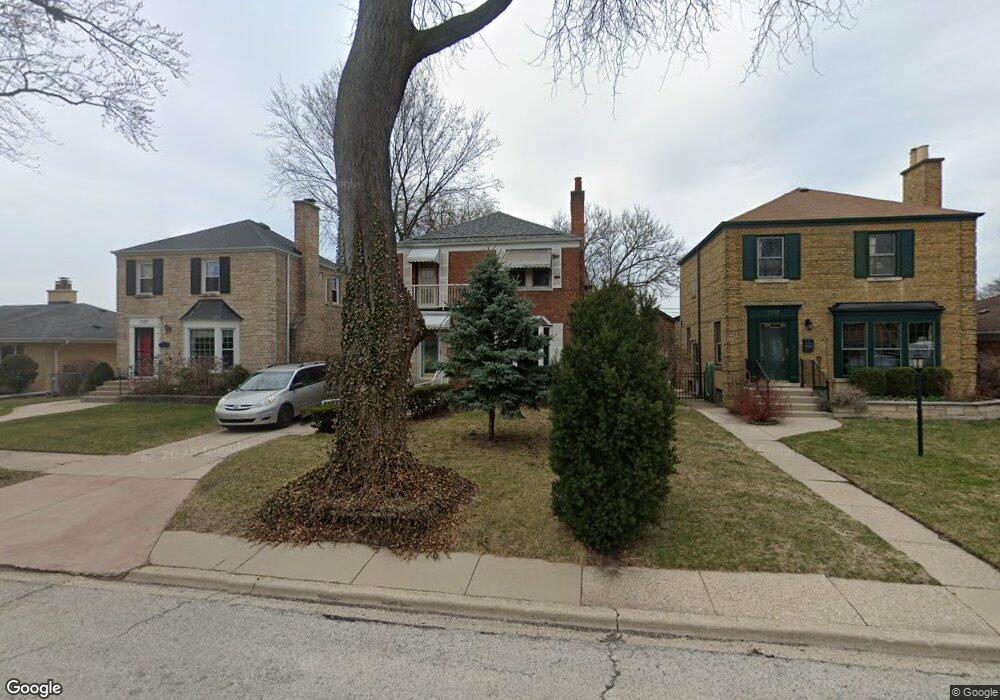
7119 N Keystone Ave Lincolnwood, IL 60712
Estimated Value: $452,482 - $511,000
3
Beds
3
Baths
1,296
Sq Ft
$379/Sq Ft
Est. Value
About This Home
This home is located at 7119 N Keystone Ave, Lincolnwood, IL 60712 and is currently estimated at $491,371, approximately $379 per square foot. 7119 N Keystone Ave is a home located in Cook County with nearby schools including Todd Hall Elementary School, Rutledge Hall Elementary School, and Lincoln Hall Middle School.
Ownership History
Date
Name
Owned For
Owner Type
Purchase Details
Closed on
Mar 31, 2025
Sold by
Judicial Sales Corporation
Bought by
Carrington Mortgage Services Llc
Current Estimated Value
Purchase Details
Closed on
Dec 28, 2010
Sold by
Marin Nicole
Bought by
Turos Constance
Purchase Details
Closed on
Dec 26, 2010
Sold by
Turos Joseph
Bought by
Turos Constance
Purchase Details
Closed on
Dec 24, 2010
Sold by
Turos Michelle
Bought by
Turos Constance
Purchase Details
Closed on
Dec 7, 2010
Sold by
Mungo Dannai M
Bought by
Turos Constance
Purchase Details
Closed on
Jul 21, 2010
Sold by
Zachary George G
Bought by
Turos Constance and Turos Michelle
Purchase Details
Closed on
Nov 12, 1999
Sold by
Pota Zachary M D John G and Pota Zachary
Bought by
Zachary John G and John G Zachary Revocable Trust
Create a Home Valuation Report for This Property
The Home Valuation Report is an in-depth analysis detailing your home's value as well as a comparison with similar homes in the area
Home Values in the Area
Average Home Value in this Area
Purchase History
| Date | Buyer | Sale Price | Title Company |
|---|---|---|---|
| Carrington Mortgage Services Llc | -- | None Listed On Document | |
| Turos Constance | -- | None Available | |
| Turos Constance | -- | None Available | |
| Turos Constance | -- | None Available | |
| Turos Constance | -- | None Available | |
| Turos Constance | -- | None Available | |
| Turos Constance | -- | None Available | |
| Zachary John G | -- | -- |
Source: Public Records
Tax History Compared to Growth
Tax History
| Year | Tax Paid | Tax Assessment Tax Assessment Total Assessment is a certain percentage of the fair market value that is determined by local assessors to be the total taxable value of land and additions on the property. | Land | Improvement |
|---|---|---|---|---|
| 2024 | $7,264 | $33,132 | $6,720 | $26,412 |
| 2023 | $4,322 | $33,132 | $6,720 | $26,412 |
| 2022 | $4,322 | $36,000 | $6,720 | $29,280 |
| 2021 | $4,754 | $24,421 | $4,800 | $19,621 |
| 2020 | $4,347 | $27,571 | $4,800 | $22,771 |
| 2019 | $4,365 | $32,340 | $4,800 | $27,540 |
| 2018 | $4,586 | $28,461 | $4,200 | $24,261 |
| 2017 | $4,525 | $30,349 | $4,200 | $26,149 |
| 2016 | $5,101 | $30,349 | $4,200 | $26,149 |
| 2015 | $5,789 | $25,243 | $3,600 | $21,643 |
| 2014 | $5,439 | $25,243 | $3,600 | $21,643 |
| 2013 | $5,443 | $25,243 | $3,600 | $21,643 |
Source: Public Records
Map
Nearby Homes
- 4021 W Estes Ave
- 3924 W Greenleaf Ave
- 6936 N Keystone Ave
- 3836 W Estes Ave
- 3819 W Greenleaf Ave
- 3846 W Touhy Ave
- 7225 N East Prairie Rd
- 7230 N Keeler Ave
- 3832 W Chase Ave
- 3814 W Sherwin Ave
- 7424 Crawford Ave
- 7412 Keeler Ave
- 7245 N Kostner Ave
- 7427 Tripp Ave
- 7201 N Lincoln Ave Unit 308
- 7201 N Lincoln Ave Unit 301
- 4465 W Lunt Ave
- 4545 W Touhy Ave Unit 511
- 4545 W Touhy Ave Unit 420
- 6750 N Kostner Ave
- 7117 N Keystone Ave
- 7123 N Keystone Ave
- 7127 N Keystone Ave
- 7109 N Keystone Ave
- 7109 N Keystone Ave
- 7114 N Crawford Ave
- 7112 N Crawford Ave
- 4020 W Estes Ave
- 7120 N Crawford Ave
- 7120 N Crawford Ave
- 7135 N Keystone Ave
- 7128 N Crawford Ave
- 7128 N Crawford Ave
- 7108 N Crawford Ave
- 7124 N Crawford Ave
- 7122 N Keystone Ave
- 7122 N Keystone Ave
- 7114 N Keystone Ave
- 4000 W Estes Ave
- 7139 N Keystone Ave