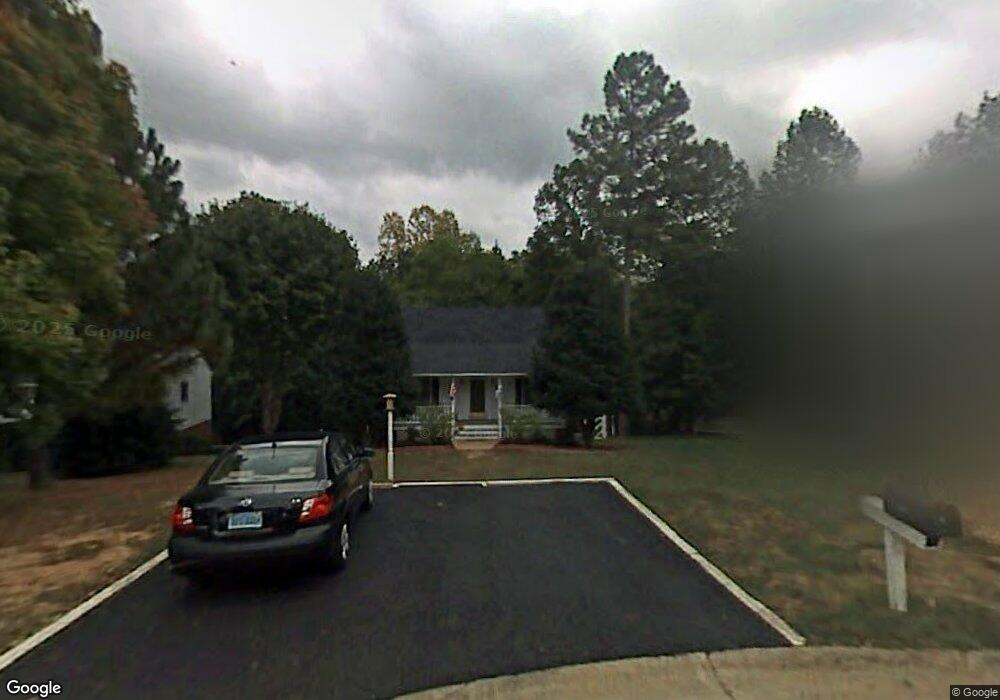
7119 Pointer Ridge Rd Midlothian, VA 23112
Estimated Value: $328,439 - $348,000
3
Beds
2
Baths
1,660
Sq Ft
$204/Sq Ft
Est. Value
About This Home
This home is located at 7119 Pointer Ridge Rd, Midlothian, VA 23112 and is currently estimated at $339,360, approximately $204 per square foot. 7119 Pointer Ridge Rd is a home located in Chesterfield County with nearby schools including Alberta Smith Elementary School, Bailey Bridge Middle School, and Manchester High.
Ownership History
Date
Name
Owned For
Owner Type
Purchase Details
Closed on
Feb 5, 2007
Sold by
Bollinger Jeffrey V
Bought by
Black Ralph
Current Estimated Value
Home Financials for this Owner
Home Financials are based on the most recent Mortgage that was taken out on this home.
Original Mortgage
$207,250
Outstanding Balance
$124,616
Interest Rate
6.23%
Mortgage Type
VA
Estimated Equity
$214,744
Purchase Details
Closed on
May 17, 2001
Bought by
Bollinger Jeffrey V
Home Financials for this Owner
Home Financials are based on the most recent Mortgage that was taken out on this home.
Original Mortgage
$12,000
Interest Rate
7.03%
Mortgage Type
New Conventional
Purchase Details
Closed on
Aug 2, 1999
Sold by
Crowell W Hunt W
Bought by
Bolliger Jeffrey V
Home Financials for this Owner
Home Financials are based on the most recent Mortgage that was taken out on this home.
Original Mortgage
$96,426
Interest Rate
7.61%
Mortgage Type
FHA
Create a Home Valuation Report for This Property
The Home Valuation Report is an in-depth analysis detailing your home's value as well as a comparison with similar homes in the area
Home Values in the Area
Average Home Value in this Area
Purchase History
| Date | Buyer | Sale Price | Title Company |
|---|---|---|---|
| Black Ralph | $202,900 | -- | |
| Bollinger Jeffrey V | -- | -- | |
| Bolliger Jeffrey V | $97,000 | -- |
Source: Public Records
Mortgage History
| Date | Status | Borrower | Loan Amount |
|---|---|---|---|
| Open | Black Ralph | $207,250 | |
| Previous Owner | Bolliger Jeffrey V | $12,000 | |
| Previous Owner | Bolliger Jeffrey V | $96,426 |
Source: Public Records
Tax History
| Year | Tax Paid | Tax Assessment Tax Assessment Total Assessment is a certain percentage of the fair market value that is determined by local assessors to be the total taxable value of land and additions on the property. | Land | Improvement |
|---|---|---|---|---|
| 2025 | $2,567 | $285,600 | $58,900 | $226,700 |
| 2024 | $2,567 | $273,100 | $57,000 | $216,100 |
| 2023 | $2,314 | $254,300 | $54,200 | $200,100 |
| 2022 | $2,128 | $231,300 | $51,300 | $180,000 |
| 2021 | $1,972 | $200,600 | $49,400 | $151,200 |
| 2020 | $1,808 | $190,300 | $47,500 | $142,800 |
| 2019 | $1,730 | $182,100 | $45,600 | $136,500 |
| 2018 | $1,684 | $177,300 | $44,700 | $132,600 |
| 2017 | $1,583 | $164,900 | $41,800 | $123,100 |
| 2016 | $1,519 | $158,200 | $40,900 | $117,300 |
| 2015 | $1,472 | $150,700 | $39,900 | $110,800 |
| 2014 | $1,402 | $143,400 | $39,000 | $104,400 |
Source: Public Records
Map
Nearby Homes
- 7303 Native Dancer Dr
- 13805 Buck Rub Dr
- 6812 Sika Ln
- 6924 Velvet Antler Dr
- 7104 Deer Run Ln
- 9506 Buffalo Springs Dr
- 8712 Bailey Hill Rd
- 13702 Nashua Terrace
- 4823 Sapphire Dr Unit 4823
- 14202 Branched Antler Place
- 24 Spinnaker Cove Dr
- 34 Spinnaker Cove Dr
- 14001 Palomino Way
- 9440 Deerpark Ct
- 6024 Watch Harbour Rd
- 5910 Harbourwood Place
- 8601 Bay Knolls Ct
- 12331 Hillcreek Turn
- 5900 Harbourwood Place
- 5201 Creek Heights Dr
- 7113 Pointer Ridge Rd
- 7121 Pointer Ridge Rd
- 7102 Spring Trace Ct
- 7100 Spring Trace Ct
- 7122 Pointer Ridge Rd
- 7104 Spring Trace Ct
- 7112 Pointer Ridge Rd
- 7120 Pointer Ridge Rd
- 7107 Pointer Ridge Rd
- 7118 Pointer Ridge Rd
- 7030 Holly Bark Dr
- 7201 Decidedly Ln
- 7106 Pointer Ridge Rd
- 7101 Pointer Ridge Rd
- 7106 Spring Trace Ct
- 7020 Holly Bark Dr
- 7200 Decidedly Ln
- 7100 Pointer Ridge Rd
- 13300 Master Stag Dr
- 7203 Decidedly Ln
Your Personal Tour Guide
Ask me questions while you tour the home.