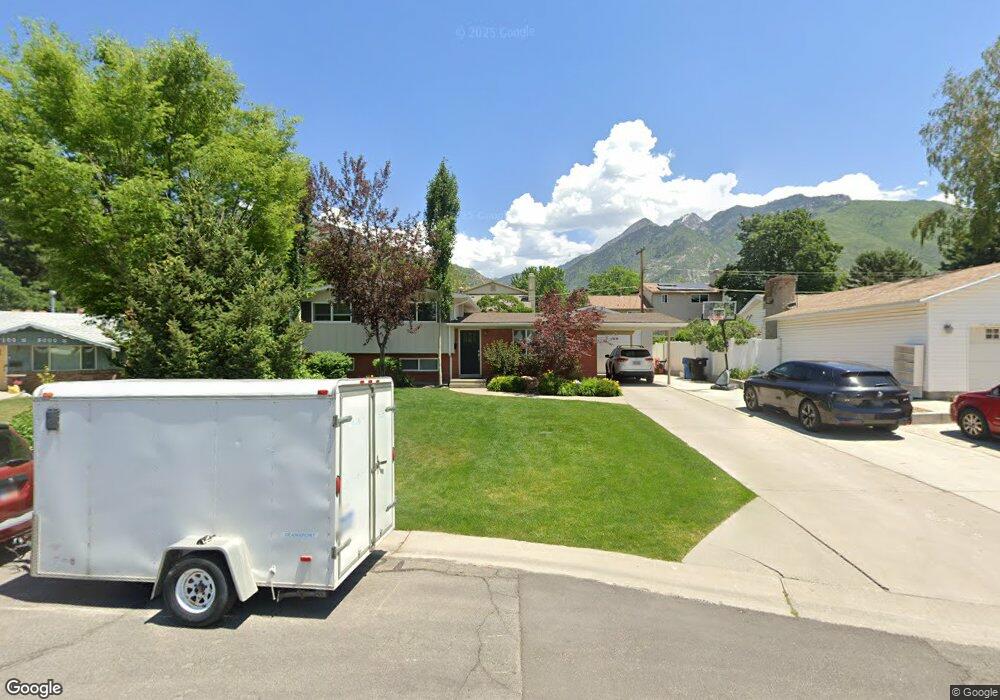
7119 S 3080 E Salt Lake City, UT 84121
Estimated Value: $596,000 - $670,000
4
Beds
2
Baths
1,750
Sq Ft
$365/Sq Ft
Est. Value
About This Home
This home is located at 7119 S 3080 E, Salt Lake City, UT 84121 and is currently estimated at $638,387, approximately $364 per square foot. 7119 S 3080 E is a home located in Salt Lake County with nearby schools including Butler School, Butler Middle School, and Brighton High School.
Ownership History
Date
Name
Owned For
Owner Type
Purchase Details
Closed on
May 23, 2024
Sold by
Hogan Christopher and Hogan Stephanie
Bought by
Last Chance Investment Llc
Current Estimated Value
Purchase Details
Closed on
Mar 8, 2021
Sold by
Hogan Christopher D
Bought by
Hogan Christopher D and Hogan Stephanie Michelle
Home Financials for this Owner
Home Financials are based on the most recent Mortgage that was taken out on this home.
Original Mortgage
$365,000
Interest Rate
2.7%
Mortgage Type
New Conventional
Purchase Details
Closed on
Feb 20, 2021
Sold by
Hogan Christopher D
Bought by
Hogan Christopher D and Hogan Stephanie Michelle
Home Financials for this Owner
Home Financials are based on the most recent Mortgage that was taken out on this home.
Original Mortgage
$365,000
Interest Rate
2.7%
Mortgage Type
New Conventional
Purchase Details
Closed on
Feb 13, 2008
Sold by
Hogan Christopher David
Bought by
Hogan Christopher D
Home Financials for this Owner
Home Financials are based on the most recent Mortgage that was taken out on this home.
Original Mortgage
$197,000
Interest Rate
6.04%
Mortgage Type
Stand Alone Refi Refinance Of Original Loan
Purchase Details
Closed on
Jul 19, 2005
Sold by
Brady Mary Ann
Bought by
Hogan Christopher David
Home Financials for this Owner
Home Financials are based on the most recent Mortgage that was taken out on this home.
Original Mortgage
$144,000
Interest Rate
5.51%
Mortgage Type
New Conventional
Purchase Details
Closed on
Jul 23, 2003
Sold by
Brady Mary Ann
Bought by
Brady Mary Ann and The Mary Ann Brady Trust
Home Financials for this Owner
Home Financials are based on the most recent Mortgage that was taken out on this home.
Original Mortgage
$105,000
Interest Rate
5.15%
Mortgage Type
Unknown
Purchase Details
Closed on
Apr 22, 2002
Sold by
Brady Mary Ann
Bought by
Brady Mary Ann and Mary Ann Brady Trust
Home Financials for this Owner
Home Financials are based on the most recent Mortgage that was taken out on this home.
Original Mortgage
$68,424
Interest Rate
6.87%
Purchase Details
Closed on
Feb 15, 1995
Sold by
Brady Mary Ann
Bought by
Brady Richard P and Brady Mary Ann
Purchase Details
Closed on
Aug 2, 1994
Sold by
Wolters Thomas E and Wolters Mary Jo
Bought by
Brady Mary Ann
Home Financials for this Owner
Home Financials are based on the most recent Mortgage that was taken out on this home.
Original Mortgage
$72,000
Interest Rate
8.51%
Create a Home Valuation Report for This Property
The Home Valuation Report is an in-depth analysis detailing your home's value as well as a comparison with similar homes in the area
Home Values in the Area
Average Home Value in this Area
Purchase History
| Date | Buyer | Sale Price | Title Company |
|---|---|---|---|
| Last Chance Investment Llc | -- | None Listed On Document | |
| Hogan Christopher D | -- | Servicelink | |
| Hogan Christopher D | -- | Servicelink | |
| Hogan Christopher D | -- | Equity Title | |
| Hogan Christopher David | -- | Landmark Title | |
| Brady Mary Ann | -- | Metro National Title | |
| Brady Mary Ann | -- | Metro National Title | |
| Brady Mary Ann | -- | Metro National Title | |
| Brady Mary Ann | -- | Metro National Title | |
| Brady Richard P | -- | -- | |
| Brady Mary Ann | -- | -- |
Source: Public Records
Mortgage History
| Date | Status | Borrower | Loan Amount |
|---|---|---|---|
| Previous Owner | Hogan Christopher D | $365,000 | |
| Previous Owner | Hogan Christopher D | $365,000 | |
| Previous Owner | Hogan Christopher D | $197,000 | |
| Previous Owner | Hogan Christopher David | $144,000 | |
| Previous Owner | Brady Mary Ann | $105,000 | |
| Previous Owner | Brady Mary Ann | $68,424 | |
| Previous Owner | Brady Mary Ann | $72,000 |
Source: Public Records
Tax History Compared to Growth
Tax History
| Year | Tax Paid | Tax Assessment Tax Assessment Total Assessment is a certain percentage of the fair market value that is determined by local assessors to be the total taxable value of land and additions on the property. | Land | Improvement |
|---|---|---|---|---|
| 2025 | $3,186 | $616,100 | $140,900 | $475,200 |
| 2024 | $3,186 | $545,200 | $126,900 | $418,300 |
| 2023 | $3,051 | $529,100 | $120,600 | $408,500 |
| 2022 | $3,326 | $540,200 | $118,200 | $422,000 |
| 2021 | $2,772 | $394,700 | $94,000 | $300,700 |
| 2020 | $2,668 | $357,100 | $94,000 | $263,100 |
| 2019 | $2,609 | $339,100 | $88,700 | $250,400 |
| 2018 | $2,592 | $317,800 | $154,900 | $162,900 |
| 2017 | $2,387 | $285,700 | $154,900 | $130,800 |
| 2016 | $2,205 | $254,300 | $139,600 | $114,700 |
| 2015 | $2,424 | $261,300 | $171,100 | $90,200 |
| 2014 | $2,290 | $249,800 | $166,500 | $83,300 |
Source: Public Records
Map
Nearby Homes
- 7129 S 3080 E
- 2995 E 7110 S
- 3184 Barnhill Bay
- 2944 E 7230 S
- 3071 E 7335 S
- 2968 Pine View Dr S
- 6877 Pineview Cir
- 2712 E 7115 S
- 6721 S Costa Cove
- 3404 Enchanted Hills Dr
- 7506 Claret St
- 7491 S 2700 E
- 7622 S Cambria Cir
- 3603 E Macintosh Ln
- 2532 E 6830 S
- 2673 Toni Cir
- 6910 S Promenade Dr
- 6680 Coba Ct
- 7367 Canyon Centre Pkwy
- 6888 S Hillside Village Cir
- 7108 S Turnagain Cove
- 7109 S 3080 E
- 7116 Turnagain Cove
- 7124 Turnagain Cove
- 7108 Turnagain Cove
- 3081 E 7110 S
- 7120 S 3080 E
- 7134 Turnagain Cove
- 7093 S Turnagain Cove
- 7098 Turnagain Cove
- 7139 S 3080 E
- 3088 E 7070 S
- 3069 E 7110 S
- 7140 S 3080 E
- 7117 S Turnagain Cove
- 7092 S Turnagain Cove
- 7125 S Turnagain Cove
- 3070 E 7070 S
- 7117 Turnagain Cove
- 3058 E 7110 S