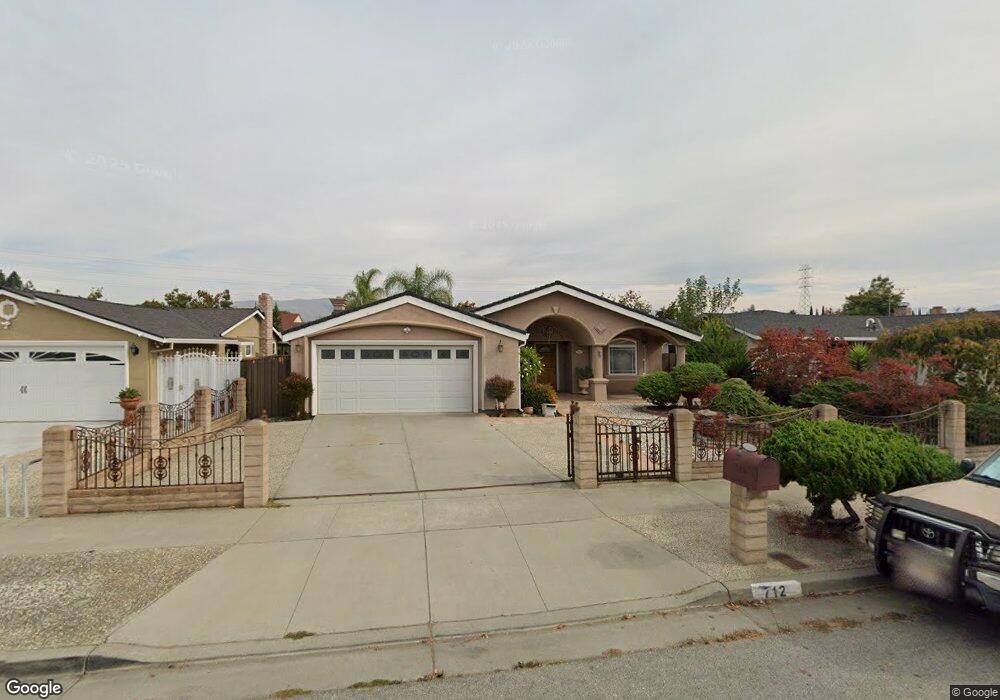
712 Anvil Ct San Jose, CA 95133
Commodore NeighborhoodEstimated Value: $1,173,691 - $1,328,000
About This Home
This home is located at 712 Anvil Ct, San Jose, CA 95133 and is currently estimated at $1,233,673, approximately $1,024 per square foot. 712 Anvil Ct is a home located in Santa Clara County with nearby schools including Summerdale Elementary School, Piedmont Middle School, and Independence High School.
Ownership History
We collect this data history from publicly available records. To have your information removed, we recommend requesting removal directly through your county’s website.
Purchase Details
Purchase Details
Home Financials for this Owner
Home Financials are based on the most recent Mortgage that was taken out on this home.Purchase Details
Purchase Details
Home Values in the Area
Average Home Value in this Area
Purchase History
We collect this data history from publicly available records. To have your information removed, we recommend requesting removal directly through your county’s website.
| Date | Buyer | Sale Price | Title Company |
|---|---|---|---|
| -- | None Available | ||
| -- | None Available | ||
| $520,000 | Chicago Title | ||
| -- | -- | ||
| -- | -- |
Mortgage History
We collect this data history from publicly available records. To have your information removed, we recommend requesting removal directly through your county’s website.
| Date | Status | Borrower | Loan Amount |
|---|---|---|---|
| Open | $410,000 |
Tax History
We collect this data history from publicly available records. To have your information removed, we recommend requesting removal directly through your county’s website.
| Year | Tax Paid | Tax Assessment Tax Assessment Total Assessment is a certain percentage of the fair market value that is determined by local assessors to be the total taxable value of land and additions on the property. | Land | Improvement |
|---|---|---|---|---|
| 2025 | $10,594 | $739,315 | $497,618 | $241,697 |
| 2024 | $10,594 | $724,819 | $487,861 | $236,958 |
| 2023 | $10,402 | $710,608 | $478,296 | $232,312 |
| 2022 | $10,359 | $696,675 | $468,918 | $227,757 |
| 2021 | $10,023 | $683,016 | $459,724 | $223,292 |
| 2020 | $9,713 | $676,014 | $455,011 | $221,003 |
| 2019 | $9,343 | $662,760 | $446,090 | $216,670 |
| 2018 | $9,209 | $649,766 | $437,344 | $212,422 |
| 2017 | $9,263 | $637,026 | $428,769 | $208,257 |
| 2016 | $8,878 | $624,536 | $420,362 | $204,174 |
| 2015 | $8,370 | $583,000 | $392,400 | $190,600 |
| 2014 | $6,427 | $470,400 | $316,600 | $153,800 |
Map
- 2344 Pacheco Dr
- 2503 Blue Rock Ct
- 661 Devlin Ct
- 614 Devlin Ct
- 2511 Easton Place Unit 48
- 2449 Kita Ln
- 2580 Gimelli Way
- 2568 Palmetta Palm Ct
- 835 Cane Palm Ct
- 542 Remi Ln
- 2599 Easton Ln Unit 109
- 2599 Easton Ln Unit 108
- 691 N Capitol Ave Unit 4
- 2671 Beechnut Dr
- 536 Foundry Ct
- 12280 Mabury Rd
- 445 N Capitol Ave Unit 430
- 909 Gilchrist Dr Unit 1
- 902 Gilchrist Walkway Unit 3
- 795 N Opie Ct
Ask me questions while you tour the home.