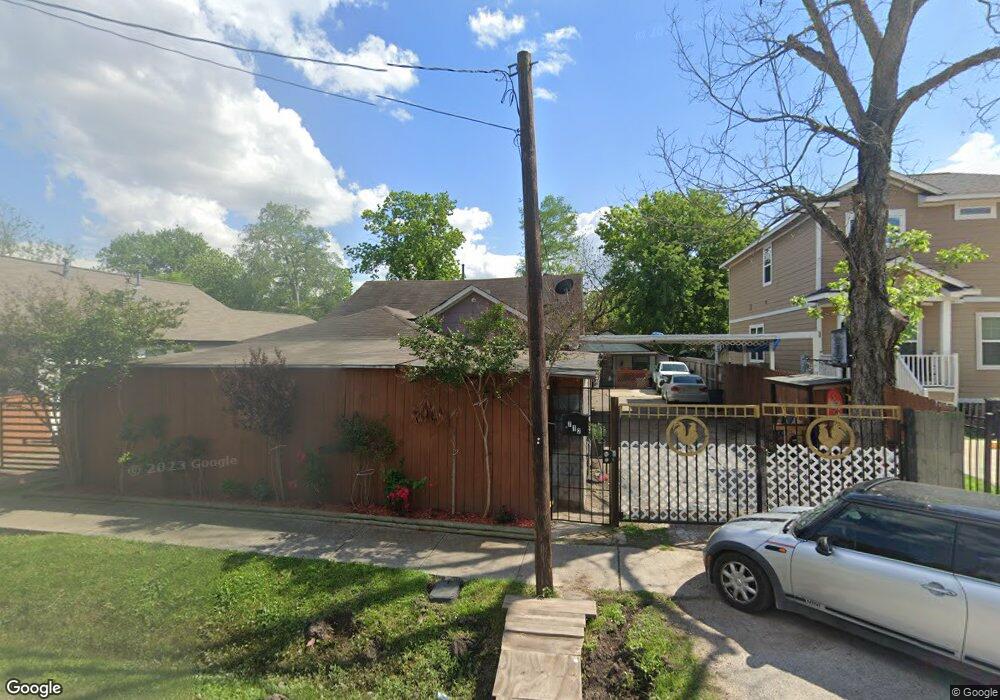
712 Barkley St Houston, TX 77022
Independence Heights NeighborhoodEstimated Value: $184,000 - $257,000
2
Beds
1
Bath
876
Sq Ft
$256/Sq Ft
Est. Value
About This Home
This home is located at 712 Barkley St, Houston, TX 77022 and is currently estimated at $224,277, approximately $256 per square foot. 712 Barkley St is a home located in Harris County with nearby schools including Kennedy Elementary School, Williams Middle, and Booker T Washington Sr High.
Ownership History
Date
Name
Owned For
Owner Type
Purchase Details
Closed on
Jan 6, 2016
Sold by
Carranza Yenifer Rivas
Bought by
Vistamont Management Inc
Current Estimated Value
Purchase Details
Closed on
Jan 14, 2010
Sold by
Vistamont Management Inc
Bought by
Carranza Yenifer Rivas
Purchase Details
Closed on
Sep 10, 2008
Sold by
Cour Valant Lp
Bought by
Vistamont Management Inc
Create a Home Valuation Report for This Property
The Home Valuation Report is an in-depth analysis detailing your home's value as well as a comparison with similar homes in the area
Home Values in the Area
Average Home Value in this Area
Purchase History
| Date | Buyer | Sale Price | Title Company |
|---|---|---|---|
| Vistamont Management Inc | $57,980 | None Available | |
| Carranza Yenifer Rivas | -- | None Available | |
| Vistamont Management Inc | -- | Fidelity National Title |
Source: Public Records
Mortgage History
| Date | Status | Borrower | Loan Amount |
|---|---|---|---|
| Closed | Carranza Yenifer Rivas | $0 |
Source: Public Records
Tax History Compared to Growth
Tax History
| Year | Tax Paid | Tax Assessment Tax Assessment Total Assessment is a certain percentage of the fair market value that is determined by local assessors to be the total taxable value of land and additions on the property. | Land | Improvement |
|---|---|---|---|---|
| 2025 | $4,073 | $188,885 | $145,800 | $43,085 |
| 2024 | $4,073 | $194,641 | $145,800 | $48,841 |
| 2023 | $4,073 | $169,421 | $129,600 | $39,821 |
| 2022 | $3,730 | $169,421 | $129,600 | $39,821 |
| 2021 | $3,267 | $140,177 | $102,600 | $37,577 |
| 2020 | $2,919 | $120,538 | $97,200 | $23,338 |
| 2019 | $2,022 | $79,893 | $48,600 | $31,293 |
| 2018 | $1,980 | $78,263 | $48,600 | $29,663 |
| 2017 | $1,569 | $62,063 | $32,400 | $29,663 |
| 2016 | $1,212 | $49,015 | $21,600 | $27,415 |
| 2015 | $638 | $49,015 | $21,600 | $27,415 |
| 2014 | $638 | $39,617 | $14,850 | $24,767 |
Source: Public Records
Map
Nearby Homes
- 4206 Oxford St
- 603 Neyland
- 4303 Cadmus St
- 508 Neyland St
- 515 E 43rd St
- 821 Neyland St
- 435 Neyland St
- 431 Neyland St
- 436 Neyland St Unit 1
- 821 Barkley St
- 4303 Castor St
- 606 E 42nd St
- 4303 Castor Na St
- 434 Barkley St
- 4305 Castor St
- 4208 Castor St Unit B
- 4208 Castor St Unit A
- 502 W Crosstimbers St
- 4109 Castor St Unit B
- 412 E Neyland St Unit F
- 710 Barkley St Unit A
- 710 Barkley St Unit B
- 710 Barkley St Unit AB
- 714 Barkley St
- 716 Barkley St
- 610 Barkley St
- 717 Neyland St
- 719 Neyland St
- 715 Neyland St
- 720 Barkley St
- 721 Neyland St
- 711 Neyland St
- 705 Barkley St
- 611 Barkley St
- 707 Barkley St
- 608 Barkley St
- 609 Barkley St
- 607 Neyland St
- 709 Barkley St
- 723 Neyland St