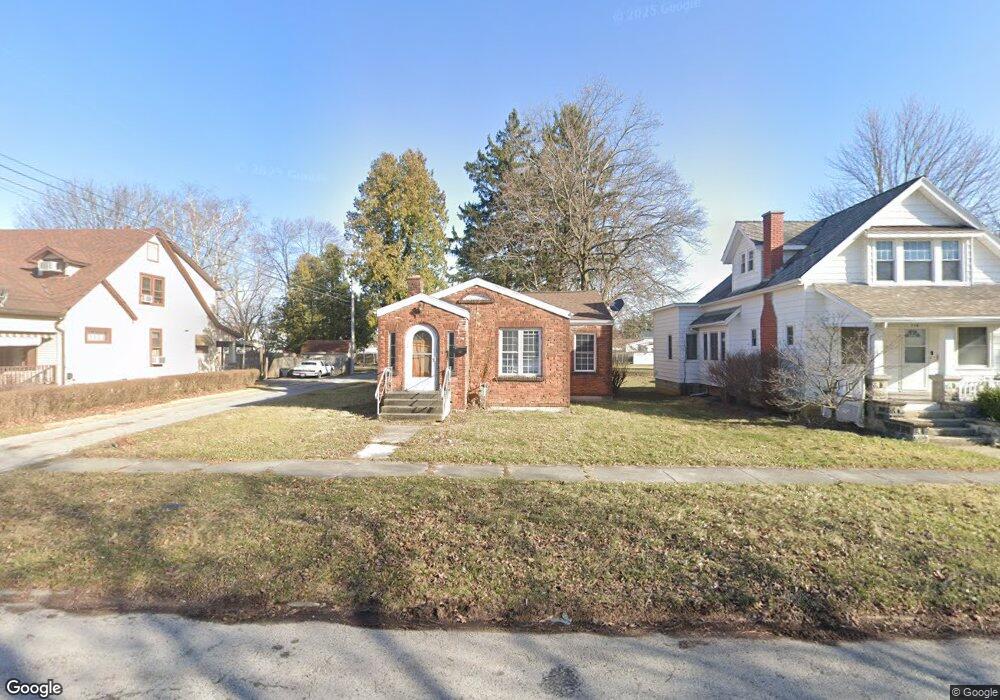
712 Cherry St Findlay, OH 45840
Estimated Value: $141,000 - $163,000
4
Beds
1
Bath
1,117
Sq Ft
$136/Sq Ft
Est. Value
About This Home
This home is located at 712 Cherry St, Findlay, OH 45840 and is currently estimated at $151,866, approximately $135 per square foot. 712 Cherry St is a home located in Hancock County with nearby schools including Whittier Elementary School, Wilson Vance Elementary School, and Donnell Middle School.
Ownership History
Date
Name
Owned For
Owner Type
Purchase Details
Closed on
Aug 18, 2025
Sold by
Dupuis Lori
Bought by
Hummell Darlene
Current Estimated Value
Purchase Details
Closed on
Jan 23, 2023
Sold by
Miles M Steven M and Miles Matthew Steven
Bought by
Dupuis Lori
Purchase Details
Closed on
Dec 23, 2010
Sold by
Adkins Karen
Bought by
Miles M Steven
Home Financials for this Owner
Home Financials are based on the most recent Mortgage that was taken out on this home.
Original Mortgage
$68,225
Interest Rate
4.4%
Mortgage Type
FHA
Purchase Details
Closed on
Jun 24, 1999
Sold by
Ohio Bank
Bought by
Smith Steven and Smith Jerilyn
Purchase Details
Closed on
Apr 15, 1994
Bought by
Gray Dennis E and Gray Sheryl K
Create a Home Valuation Report for This Property
The Home Valuation Report is an in-depth analysis detailing your home's value as well as a comparison with similar homes in the area
Home Values in the Area
Average Home Value in this Area
Purchase History
| Date | Buyer | Sale Price | Title Company |
|---|---|---|---|
| Hummell Darlene | $35,000 | Assured Title | |
| Dupuis Lori | -- | None Listed On Document | |
| Dupuis Lori | -- | None Listed On Document | |
| Miles M Steven | $70,000 | Assured Title | |
| Smith Steven | $62,000 | -- | |
| Gray Dennis E | $50,000 | -- |
Source: Public Records
Mortgage History
| Date | Status | Borrower | Loan Amount |
|---|---|---|---|
| Previous Owner | Miles M Steven | $68,225 |
Source: Public Records
Tax History
| Year | Tax Paid | Tax Assessment Tax Assessment Total Assessment is a certain percentage of the fair market value that is determined by local assessors to be the total taxable value of land and additions on the property. | Land | Improvement |
|---|---|---|---|---|
| 2024 | $1,224 | $34,430 | $5,180 | $29,250 |
| 2023 | $1,225 | $34,430 | $5,180 | $29,250 |
| 2022 | $1,534 | $34,430 | $5,180 | $29,250 |
| 2021 | $1,149 | $25,590 | $5,450 | $20,140 |
| 2020 | $1,042 | $25,590 | $5,450 | $20,140 |
| 2019 | $1,021 | $25,590 | $5,450 | $20,140 |
| 2018 | $977 | $22,480 | $4,740 | $17,740 |
| 2017 | $489 | $22,480 | $4,740 | $17,740 |
| 2016 | $974 | $22,480 | $4,740 | $17,740 |
| 2015 | $1,124 | $25,690 | $4,740 | $20,950 |
| 2014 | $1,124 | $25,690 | $4,740 | $20,950 |
| 2012 | $1,133 | $25,690 | $4,740 | $20,950 |
Source: Public Records
Map
Nearby Homes
- 439 Carnahan Ave
- 640 Center St
- 810 Mcconnell St
- 1020 Country Club Dr
- 741 Central Ave
- 523 Center St
- 1125 Glen Meadow Dr
- 1308 Greendale Ave
- 1209 Heather Dr
- 716 Winfield Ave
- 912 Parkside Place
- 309 Huron Rd
- 1001 Decker Ave
- 213 Cherry St
- 1521 Middle Ct
- 125 Cherry St
- 1142 Concord Ct
- 204 Laquineo St
- 1216 Concord Ct
- 1450 Fostoria Ave
- 714 Cherry St
- 706 Cherry St
- 716 Cherry St
- 420 Carnahan Ave
- 704 Cherry St
- 718 Cherry St
- 713 Cherry St
- 419 Central Ave
- 422 Carnahan Ave
- 415 Central Ave
- 415 Central Ave Unit 1
- 702 Cherry St
- 423 Central Ave
- 715 Cherry St
- 705 Cherry St
- 424 Carnahan Ave
- 802 Cherry St
- 711 Cherry St
- 425 Central Ave
- 717 Cherry St
Your Personal Tour Guide
Ask me questions while you tour the home.